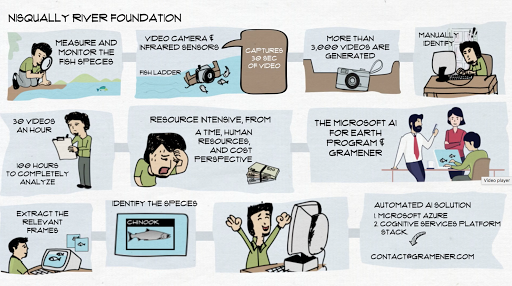
Supply chain solution

This Sankey or flow diagram is a data-driven solution which incorporates design thinking principles and visual communication to identify bottlenecks in the supply chain

overall viz

Hover to zoom!

Actionable insights

This is a demonstration of a supply chain solution driven by data and the grammar of graphics.

Try to avoid shifting a 20% part shipment of ZDH products on a Friday morning, as this will cause delays.

Don't worry too much about delays of a 20-40% part shipment of FAH products on a Saturday morning.

No, these insights are not from a concealed crystal ball which predicts the future - they are gleaned from data which the client already has!

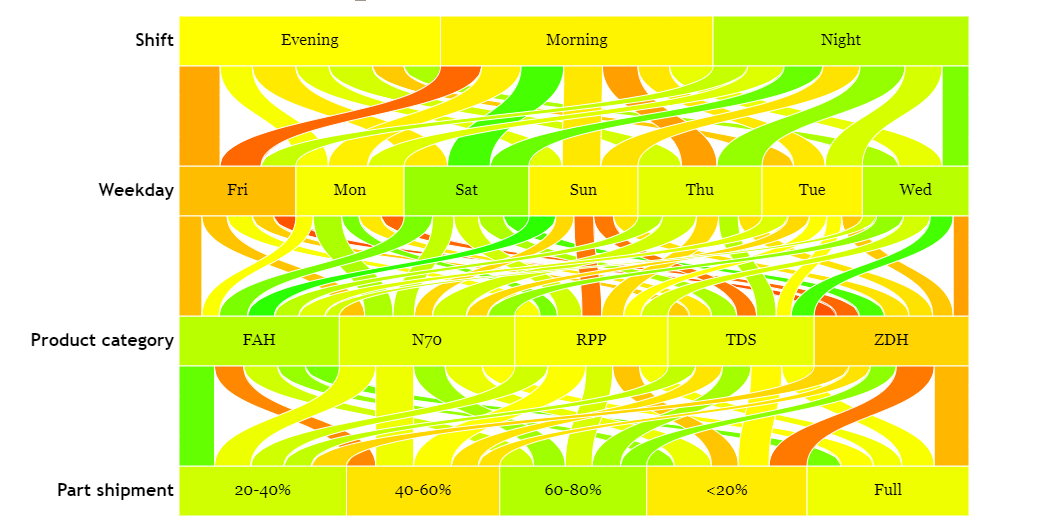
The visualisation below is a detailed breakdown of where the client faces the most delays and where they perform best.

Recovery time (hours): >= 1.5 2.00 1.75 1.50
Trained staff 5
Shift Evening: 1.75 hrs (1 forklifts) Morning: 1.76 hrs (1 forklifts) Night: 1.68 hrs (1 forklifts) Evening Morning Night Weekday Fri: 1.81 hrs Mon: 1.74 hrs Sat: 1.65 hrs Sun: 1.76 hrs Thu: 1.72 hrs Tue: 1.76 hrs Wed: 1.68 hrs Fri Mon Sat Sun Thu Tue Wed Product category FAH: 1.68 hrs N70: 1.72 hrs RPP: 1.74 hrs TDS: 1.73 hrs ZDH: 1.79 hrs FAH N70 RPP TDS ZDH Part shipment 20-40%: 1.70 hrs 40-60%: 1.78 hrs 60-80%: 1.68 hrs <20%: 1.77 hrs Full: 1.73 hrs 20-40% 40-60% 60-80% <20% Full ('Evening', 'Fri'): 1.83 hrs (0 forklifts) ('Evening', 'Mon'): 1.74 hrs (1 forklifts) ('Evening', 'Sat'): 1.77 hrs (1 forklifts) ('Evening', 'Sun'): 1.72 hrs (1 forklifts) ('Evening', 'Thu'): 1.71 hrs (1 forklifts) ('Evening', 'Tue'): 1.80 hrs (0 forklifts) ('Evening', 'Wed'): 1.67 hrs (1 forklifts) ('Morning', 'Fri'): 1.90 hrs (0 forklifts) ('Morning', 'Mon'): 1.77 hrs (1 forklifts) ('Morning', 'Sat'): 1.57 hrs (2 forklifts) ('Morning', 'Sun'): 1.77 hrs (1 forklifts) ('Morning', 'Thu'): 1.84 hrs (0 forklifts) ('Morning', 'Tue'): 1.77 hrs (1 forklifts) ('Morning', 'Wed'): 1.73 hrs (1 forklifts) ('Night', 'Fri'): 1.69 hrs (1 forklifts) ('Night', 'Mon'): 1.72 hrs (1 forklifts) ('Night', 'Sat'): 1.60 hrs (1 forklifts) ('Night', 'Sun'): 1.78 hrs (1 forklifts) ('Night', 'Thu'): 1.65 hrs (1 forklifts) ('Night', 'Tue'): 1.71 hrs (1 forklifts) ('Night', 'Wed'): 1.62 hrs (1 forklifts) ('Fri', 'FAH'): 1.82 hrs ('Fri', 'N70'): 1.81 hrs ('Fri', 'RPP'): 1.74 hrs ('Fri', 'TDS'): 1.80 hrs ('Fri', 'ZDH'): 1.92 hrs ('Mon', 'FAH'): 1.75 hrs ('Mon', 'N70'): 1.67 hrs ('Mon', 'RPP'): 1.62 hrs ('Mon', 'TDS'): 1.77 hrs ('Mon', 'ZDH'): 1.90 hrs ('Sat', 'FAH'): 1.62 hrs ('Sat', 'N70'): 1.69 hrs ('Sat', 'RPP'): 1.71 hrs ('Sat', 'TDS'): 1.67 hrs ('Sat', 'ZDH'): 1.57 hrs ('Sun', 'FAH'): 1.54 hrs ('Sun', 'N70'): 1.79 hrs ('Sun', 'RPP'): 1.88 hrs ('Sun', 'TDS'): 1.88 hrs ('Sun', 'ZDH'): 1.78 hrs ('Thu', 'FAH'): 1.68 hrs ('Thu', 'N70'): 1.71 hrs ('Thu', 'RPP'): 1.78 hrs ('Thu', 'TDS'): 1.68 hrs ('Thu', 'ZDH'): 1.78 hrs ('Tue', 'FAH'): 1.72 hrs ('Tue', 'N70'): 1.79 hrs ('Tue', 'RPP'): 1.75 hrs ('Tue', 'TDS'): 1.75 hrs ('Tue', 'ZDH'): 1.80 hrs ('Wed', 'FAH'): 1.71 hrs ('Wed', 'N70'): 1.65 hrs ('Wed', 'RPP'): 1.71 hrs ('Wed', 'TDS'): 1.57 hrs ('Wed', 'ZDH'): 1.84 hrs ('FAH', '20-40%'): 1.60 hrs ('FAH', '40-60%'): 1.87 hrs ('FAH', '60-80%'): 1.70 hrs ('FAH', '<20%'): 1.65 hrs ('FAH', 'Full'): 1.62 hrs ('N70', '20-40%'): 1.73 hrs ('N70', '40-60%'): 1.73 hrs ('N70', '60-80%'): 1.66 hrs ('N70', '<20%'): 1.73 hrs ('N70', 'Full'): 1.75 hrs ('RPP', '20-40%'): 1.70 hrs ('RPP', '40-60%'): 1.75 hrs ('RPP', '60-80%'): 1.71 hrs ('RPP', '<20%'): 1.81 hrs ('RPP', 'Full'): 1.74 hrs ('TDS', '20-40%'): 1.69 hrs ('TDS', '40-60%'): 1.78 hrs ('TDS', '60-80%'): 1.66 hrs ('TDS', '<20%'): 1.76 hrs ('TDS', 'Full'): 1.74 hrs ('ZDH', '20-40%'): 1.79 hrs ('ZDH', '40-60%'): 1.78 hrs ('ZDH', '60-80%'): 1.64 hrs ('ZDH', '<20%'): 1.88 hrs ('ZDH', 'Full'): 1.82 hrs

Using this visualisation

This Sankey diagram specializes in locating bottlenecks in the supply chain. Each long rectangular bar depicts a stage in the logistics flow.

Click on a rectangle to see reveal the delay for that particular shift, day or product.

Colours indicate the quantum of delay. Shades of yellow and red indicate more delays. Shades of green have a lower delay time.

The "Delay filter" helps in mapping delays greater or less than a particular number of hours, while the "Trained staff" filter emulates the delays according to the number of trained staff available.

The video on the left shows you the worst-performing shift, day, and part-shipment metrics of the ZDH product.

worst times

Hover to zoom!

Day in, day out

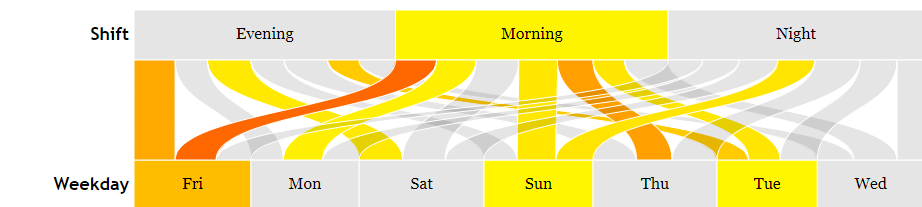
From the outset, we find that of the three shifts, the night shift has the lowest average delay, while the morning and evening shifts have similar delays.

Let's drill down further. Just before the weekend starts are when when things slow down the most -- Thursdays and Fridays show the most delays, particularly mornings.

The image on the right shows the worst shifts and days.

Now that we have the not-so-good news out of the way, let's move on to where the client performs the best. Saturdays and Wednesdays are when things are looking up. The lowest delays are on these two days, with Saturday mornings taking the cake with the least delay time.

Would you like to build a visualization like this?


Check out more of our work

Case study

Say hello to new fish with Artificial Intelligence

Our finned and gilled friends in the ocean can now be easily identified and recorded by biologists thanks to Gramener and Microsoft's smart AI solution to automate the process.