Introduction
Mapviewer is an abstraction over Leaflet that can create common GIS applications using configurations.
Installation
Mapviewer requires npm install leaflet d3 d3-scale-chromatic g1.
// leaflet is used internally by mapviewer
<link rel="stylesheet" href="ui/leaflet/dist/leaflet.css">
<script src="ui/leaflet/dist/leaflet.js"></script>
<script src="ui/d3/build/d3.js"></script>
// d3-scale-chromatic is not required if d3 is v5
<script src="ui/d3-scale-chromatic/dist/d3-scale-chromatic.min.js"></script>
// load mapviewer via g1
<script src="ui/g1/dist/mapviewer.min.js"></script>
Getting started
This creates a simple base map<style scoped>
#base-map {
height: 300px;
}
</style>
<div id="base-map"></div>
<script>
g1.mapviewer({
id: 'base-map',
layers: {
worldMap: { type: 'tile', url: 'http://{s}.tile.openstreetmap.org/{z}/{x}/{y}.png' }
}
})
</script>Options
Mapviewer options are listed at g1 docs.
Features
Mapviewer currently supports markers, circle markers, choropleth, drilldown abilities.
Markers
<style scoped>
#markers-map {
height: 500px;
}
</style>
<div id="markers-map"></div>
<script>
g1.mapviewer({
id: 'markers-map',
fitbounds: {paddingTopLeft: [55, 55], animate: false},
layers: {
worldMapper: { type: 'tile', url: 'http://{s}.tiles.wmflabs.org/bw-mapnik/{z}/{x}/{y}.png' },
cityCircleMarkers: {
type: 'marker',
url: 'cities.json',
latitude: 'lat',
longitude: 'long',
options: {
title: '$$ tooltip text',
},
tooltip: function (d) {
return `<div>State: ${d.name}</div>`
}
}
}
})
</script>
Circle Markers
<style scoped>
#circlemarker-map {
height: 500px;
width: 60%;
}
</style>
<div id="circlemarker-map"></div>
<script>
g1.mapviewer({
id: 'circlemarker-map',
layers: {
worldMap: { type: 'tile', url: 'http://{s}.tile.openstreetmap.org/{z}/{x}/{y}.png' },
cityMarkers: {
type: 'circleMarker',
url: 'cities.json',
latitude: 'lat',
longitude: 'long',
tooltip: function (d) {
return `${d.name}: ${d.crimes}`
},
attrs: {
fillColor: {
metric: 'pollution',
scheme: 'RdYlGn'
}
}
}
}
})
</script>
Choropleth
<style scoped>
#choropleth-map {
height: 500px;
width: 60%;
}
</style>
<div id="choropleth-map"></div>
<script>
g1.mapviewer({
id: 'choropleth-map',
layers: {
worldMap: { type: 'tile', url: 'http://{s}.tile.openstreetmap.org/{z}/{x}/{y}.png' },
indiaGeojson: {
type: 'geojson',
url: 'india-states.geojson',
link: {
url: 'state_score.json', // Load data from this file
dataKey: 'name', // Join this column from the URL (data)
mapKey: 'ST_NM' // with this property in the GeoJSON
},
options: {
style: {
fillColor: '#a00',
fillOpacity: 1
}
},
tooltip: function(d) {
return `${d.ST_NM} population: ${d.TOT_P}`;
},
attrs: {
fillColor: { // Fill the regions
metric: 'score', // with the 'score' column from state_score.json
scheme: 'RdYlGn' // using a RdYlGn gradient
}
}
}
}
})
</script>
Drilldown
<style scoped>
#drilldown-map {
height: 500px;
width: 60%;
}
</style>
<div id="drilldown-map"></div>
<script>
var drilldown_map = g1.mapviewer({
id: 'drilldown-map',
layers: {
worldMap: { type: 'tile', url: 'http://{s}.tile.openstreetmap.org/{z}/{x}/{y}.png' },
indiaGeojson: {
type: 'geojson',
url: 'india-states.geojson',
link: {
url: 'state_score.json',
dataKey: 'name',
mapKey: 'ST_NM'
},
attrs: {
fillColor: {
metric: 'TOT_P',
scheme: 'Viridis'
},
fillOpacity: 1,
color: '#fff',
weight: 0.5
}
},
},
drilldown: {
rootLayer: 'indiaGeojson',
levels: [
{
layerName: function(props) { return props['ST_NM'].toLowerCase() + '-layer'},
layerOptions: {
// url: function(props) { return props['ST_NM'].toLowerCase() + '-census.json'},
url: function() { return 'kerala-census.json'},
type: 'geojson',
attrs: {
fillColor: {
metric: 'DT_CEN_CD',
scheme: 'Viridis'
},
fillOpacity: 1,
tooltip: function (properties) {
return 'DISTRICT: ' + properties['DISTRICT']
}
}
}
},
{
layerName: 'ernakulam-layer',
layerOptions: {
url: 'ernakulam-census.json',
type: 'geojson',
options: {
style: {
fillColor: '#ccc'
}
},
attrs: {
fillColor: {
metric: 'TOT_P',
scheme: 'Viridis'
},
fillOpacity: 1,
weight: 1.5,
color: '#fff',
tooltip: function (properties) {
return '<div><i class="fa fa-home"></i> VILLAGE: ' + properties['NAME'] + '</div>'
}
}
}
}
]
}
})
$(".leaflet-control-zoom-in").removeAttr('href').addClass('cursor-pointer')
$(".leaflet-control-zoom-out").removeAttr('href').addClass('cursor-pointer')
$(".leaflet-control-zoom").append('<a class="leaflet-control-zoom-reset" href="#" title="Zoom reset" role="button" aria-label="Zoom out"><i class="fa fa-undo fa-lg"></i></a>')
$(".leaflet-control-zoom-reset").on("click", function (evt) {
evt.preventDefault()
drilldown_map.drillup()
})
</script>
Basetiles
<style scoped>
div.basemaps>div {
height: 300px;
width: 40%;
}
</style>
<div class="container basemaps">
<div id="basemap0"></div>
<div id="basemap1"></div>
<div id="basemap2"></div>
<div id="basemap3"></div>
<div id="basemap4"></div>
<div id="basemap5"></div>
<div id="basemap6"></div>
<div id="basemap7"></div>
<div id="basemap8"></div>
<div id="basemap9"></div>
</div>
<script>
var tiles = [
{
name: 'World Terrain',
url: 'https://server.arcgisonline.com/ArcGIS/rest/services/World_Terrain_Base/MapServer/tile/{z}/{y}/{x}'
},
{
name: 'OSM black and white',
url: 'http://{s}.tiles.wmflabs.org/bw-mapnik/{z}/{x}/{y}.png'
},
{
name: 'Open Topomap',
url: 'https://stamen-tiles-{s}.a.ssl.fastly.net/watercolor/{z}/{x}/{y}.png'
},
{
name: 'ThunderForest Transport',
url: 'https://{s}.tile.thunderforest.com/spinal-map/{z}/{x}/{y}.png?apikey=db5ae1f5778a448ca662554581f283c5'
},
{
name: 'Grey Roads',
url: 'https://korona.geog.uni-heidelberg.de/tiles/roadsg/x={x}&y={y}&z={z}'
},
{
name: 'Night mode',
url: "https://map1.vis.earthdata.nasa.gov/wmts-webmerc/VIIRS_CityLights_2012/default/{time}/{tilematrixset}{maxZoom}/{z}/{y}/{x}.{format}",
options: {
bounds: [[-85.0511287776, -179.999999975], [85.0511287776, 179.999999975]],
minZoom: 1,
maxZoom: 8,
format: 'jpg',
time: '',
tilematrixset: 'GoogleMapsCompatible_Level'
}
},
{
name: 'OSM France',
url: 'https://{s}.tile.openstreetmap.fr/osmfr/{z}/{x}/{y}.png'
},
{
name: 'OSM HOT',
url: 'https://{s}.tile.openstreetmap.fr/hot/{z}/{x}/{y}.png'
},
{
name: 'ThunderForest OpenCycleMap',
url: 'https://{s}.tile.thunderforest.com/cycle/{z}/{x}/{y}.png?apikey=db5ae1f5778a448ca662554581f283c5'
},
{
name: 'Stamen Toner',
url: 'http://tile.stamen.com/toner/{z}/{x}/{y}.png'
}
]
tiles.map(function(tile, index) {
g1.mapviewer({
id: 'basemap' + index,
map: tile.mapoptions ? tile.mapoptions : {
center: [9.98, 76.3],
zoom: 9
},
layers: {
worldMap: { type: 'tile', url: tile.url, options: tile.options}
}
})
})
</script>
How-to
Control map
Mapviewer extends Leaflet attributes to control zoom and other options.
<div id="map-controls"></div>
<script>
g1.mapviewer({
id: 'map-controls',
map: {
// disable leaflet attribution
attributionControl: false,
zoomSnap: 0.1,
// disable zoom by double clicking the map area
doubleClickZoom: false,
// disable zoom by mouse scroll
scrollWheelZoom: false,
// disable map dragging
dragging: false,
// disable keyboard controls
keyboard: false
},
// ...
})
</script>
Map region colors
Different scales are supported in Mapviewer.
linear or quantile or threshold scales can be defined based on the data.
Mapviewer is agnostic to the scale -- that is, data needs to be precalculated as
(in case of quantile scale) quantiles and colors need to be defined for each
quantile range.
linear scale definition would be as follows.
// map_value - district specific values
domain_values.push(d3.min(map_value))
domain_values.push(d3.mean(map_value))
domain_values.push(d3.max(map_value))
// sets the domain_values from minimum to maximum values with a mid value
quantile scale definition would be as follows.
// consider below quantile calculation where 38 districts are uniformly categorized
var unique_districts = ['Araria', 'Arwal', ....] // 38 districts in Bihar
var category_length = Math.floor((unique_districts.length - 1) * 0.25)
var domain_values = []
for (var i = 0; i < 5; i++) {
// map_value - district specific values
domain_values.push(map_value[i * category_length])
}
threshold scale definition would be as follows.
domain_values = [0.34, 0.66, 1] // custom values can be defined here
<div id="map-controls"></div>
<script>
/* globals range, domain_values, scale, composite_index */
g1.mapviewer({
id: 'map-controls',
map: {
},
attrs: {
fillColor: {
// Fill the regions
metric: function(d) {
return d[composite_index] // composite_index refers to an attribute
},
scale: scale,
domain: domain_values,
range: range // range is an array of colors
}
}
})
</script>
Click events
Click events can be written for each of the map layers once the parent layer
(in below example, it is biharGeojson) is rendered.
Consider the example below.
<div id="map-clickevent"></div>
<script>
// load bihar-districts geojson and render the map
var map = g1.mapviewer({
id: 'map-clickevent',
layers: {
biharGeojson: {
type: 'geojson',
url: 'static/data/bihar-districts.json',
}
}
// ...
})
/* globals url, toCamelCase */
// once the layer is loaded, we can write functionality within 'biharGeojsonLoaded' event
map.on('biharGeojsonloaded', function() {
// iterate through each sublayer
map.gLayers['biharGeojson'].eachLayer(function(sublayer) {
// define the click event
sublayer.on('click', function() {
// whenever a layer (here, a district) is clicked, we update the URL params and reload the page
// this refresh the data on the entire page (contains several card components, map, bar chart)
map._choropleth('biharGeojson', map.options.layers.biharGeojson, function(props){
if (props['DISTRICT'] === sublayer.feature.properties.DISTRICT){
url.update({'district': toCamelCase(props['DISTRICT'])})
history.pushState({}, '', url.toString())
window.location.href = url
}
return (props['DISTRICT'] === sublayer.feature.properties.DISTRICT)
})
})
})
})
</script>Leaflet.
Custom tooltip content
Custom content for tooltip at each Layer cannot be rendered until parent layer
(in below example, it is biharGeojson) is not rendered.
Consider the example below.
<div id="map-tooltip"></div>
<script>
var map = g1.mapviewer({
id: 'map-tooltip',
layers: {
biharGeojson: {
type: 'geojson',
url: 'static/data/bihar-districts.json',
}
}
})
// once the layer is loaded, we can write functionality within 'biharGeojsonLoaded' event
map.on('biharGeojsonloaded', function() {
// iterate through each sublayer
map.gLayers['biharGeojson'].eachLayer(function(sublayer) {
var tooltip_cont = `<div class="card" id="map-tooltip">
<div class="card-header custom-bg-1 rounded-0 border-0 py-2">
<p class="mb-0">` + (sublayer.feature.properties.DISTRICT) + `</p>
</div></div>`
// set the tooltip content per sublayer, its direction and position
sublayer._tooltip._content = tooltip_cont
sublayer._tooltip.options.direction = "auto"
sublayer._tooltip.options.offset = [60, 10]
})
})
</script>
Resources and Tutorials
Resources
Mapshaper
Use mapshaper to view, edit, compress, export map files. It accepts multiple file types and exports toGeoJSON, TopoJSON.
It also has an excellent command-line utility support.
QGIS
QGIS is a powerful cross platform software allows viewing, editing of shapefiles with layer-level control. It has support to export the shapefiles to GeoJSON in custom coordinates.Leaflet
leafletjs is a JavaScript library to render maps on web interfaces.Tutorials
Video introduction
Here's a detailed introduction to Mapviewer, its background and possibilities.
Shapefiles can get large in size due to different reasons:
original GeoJSON could be of high quality, GeoJSON layer could have
several attributes which might not be used in your application.
How to optimize your mapfile with mapshaper
Often your application might not need a detailed view of the map. Simplifying the boundaries of the map will still retain geographic boundaries without distortion. Mapshaper allows us to simplify maps to great extent using different algorithms.
- Go to mapshaper.org
- Load your region's
GeoJSON. In this example, we use theGeoJSONof Uttar Pradesh. - Activate simplify view (top right,
Simplifyoption). You can pick from one of the listed algorithms and a percentage level to simplify the map. Choose a percentage level that doesn't distort the map. - Export the simplified file (top right,
Exportoption)
Filter attributes in map file in mapshaper
Depending on the source of your GeoJSON or TopoJSON file,
it can contain several data attributes. Your application might not need all attributes.
Mapshaper gives the ability to do this on the browser but via commands.
- Go to mapshaper.org
- Load your region's
GeoJSON. In this example, we use theGeoJSONof Uttar Pradesh. - Activate information view (right-side,
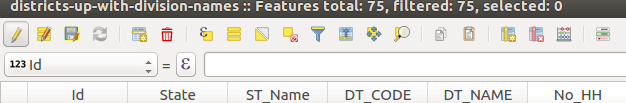
iicon). Click a region to view its attributes (Id, State, Statename, DT_CODE etc.)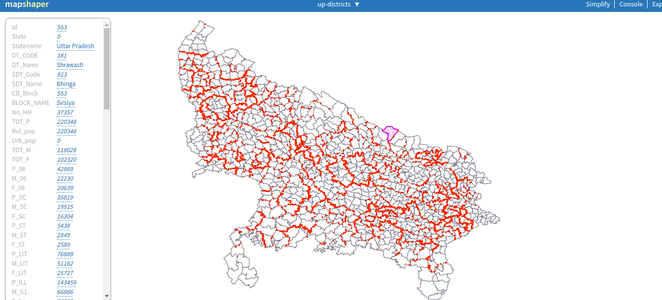
- Activate console view (top right,
Consoleoption). Console option lets you control the layer with all options.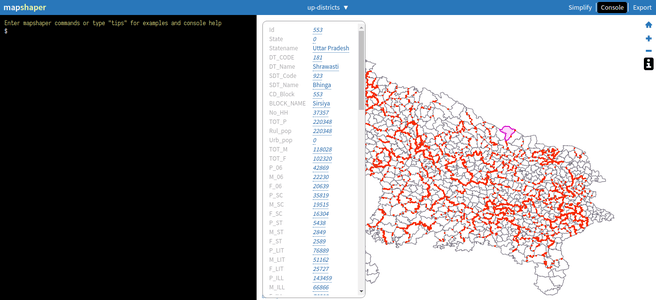
- Filter only the necessary attributes using a command. Here we are interested in a small subset of fields:
Id, State, Statename, DT_CODE, DT_Name, CD_Block, BLOCK_NAME.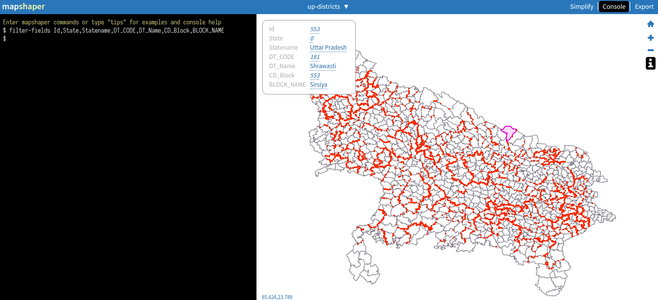
- Export the filtered file (top right,
Exportoption) in a suitable format.
Create a custom region map file in QGIS
India map at state level, district level, block level are commonly used. If you were to use a custom region map, say division level. How would one go about creating such map? At an abstract level, state contains divisions, each division contains districts, each district contains blocks and each block contains villages.
Part A - Use QGIS tool to add DIVISION property
- Load districts shapefile (
.shp) in QGIS tool - Click Layer on toolbar on top and select
Attribute Table - Toggle editing mode (top left-most)
- Click New Field option (4th from the right on the toolbar)
- Name your new field
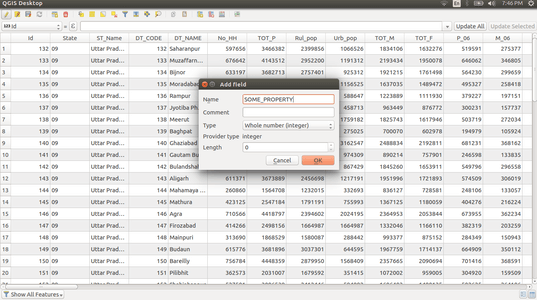
- View and edit the new field by clicking on specific cells
- Save and Export. On the bottom left of QGIS, in Layers Panel click
Save As, choose a format of your choice.
Part B - Join layers using DIVISION property - mapshaper.org
- Load the
GeoJSONfile from above in mapshaper.org - Enable information view (i icon on the right panel)
- Enable console mode (click console on top right)
- (Optional based on the
GeoJSON) Filter specific fields - run this in consolefilter-fields Id,State,ST_Name,DT_CODE,DT_NAME,DIVISION - Merge district layers based on DIVISION name
dissolve2 fields=DIVISION copy-fields=Id,State,ST_Name
TopoJSON and use.