
Every time I run HDBSCAN on real-life dataset, this is what my results typically look like:
- Cluster
# -1("others"): 50% of the data! - Cluster
#1: 5% of the data - Cluster
#2: 4% of the data - Cluster
#3: 3% of the data - ...
Here's proof from real-life examples. See how large the "Others" cluster is:
| Dataset | Others | #1 | #2 | #3 | Count |
|---|---|---|---|---|---|
| Marvel characters' powers | 52.2% | 5.2% | 2.0% | 1.9% | 96 |
| Singapore flat prices | 40.9% | 8.7% | 7.9% | 6.9% | 50 |
| American community survey | 77.7% | 2.4% | 2.0% | 1.2% | 40 |
Though the US county demographics ended up with 3 distinct clusters:
- 52% non-oil-and-gas counties
- 4% elderly counties where people sleep well
- 43% "Others" - Indian / Native Alaskan counties where people aren't obese
... in every case, HDBSCAN bucketed over 40% of the data into an "Others" category that can't be clustered.
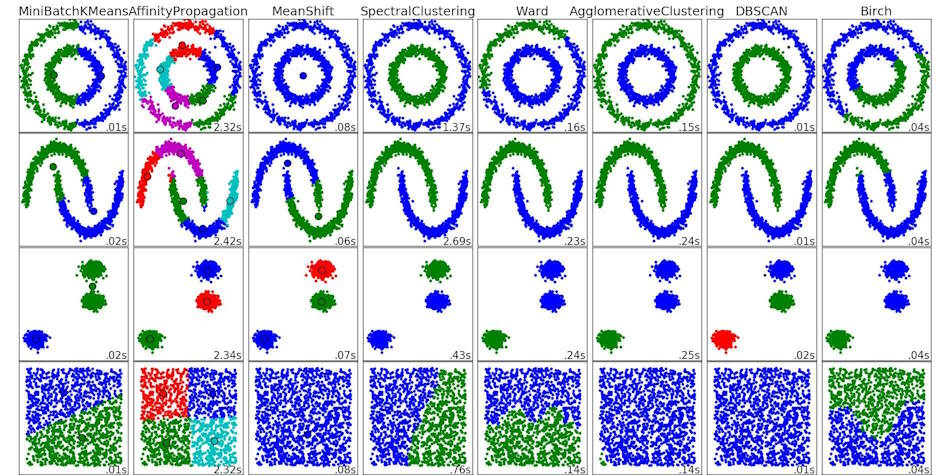
That's because HDBSCAN looks for clearly differentiated clusters. If there ARE no clusters, it clubs all the data into a single cluster. (See the last row under DBSCAN.)
But sometimes, we aren't interested in clearly defined clusters. We're want segments we can act on.
For example, how can we think about Marvel characters? With K-Means, we can force-segment them into 6 segments:
- Cluster 0 (20%) - Slow fighters - has high Fighting Skills (min), high Fighting Skills (max), low Speed (min), low Energy Projection (min)
- Cluster 1 (23%) - Weaklings - has low Durability (max), low Energy Projection (max), low Fighting Skills (max), low Intelligence (max)
- Cluster 2 (11%) - Speedsters - has high Speed (min), high Speed (max), high Energy Projection (max), high Energy Projection (min)
- Cluster 3 (12%) - Thinkers - has high Intelligence (min), high Intelligence (max), low Speed (min), low Fighting Skills (min)
- Cluster 4 (17%) - Weaklings - has low Strength (max), low Strength (min), low Intelligence (max), low Intelligence (min)
- Cluster 5 (17%) - Bulldozers - has low Intelligence (min), low Intelligence (max), high Strength (max), high Durability (max)
This gives us a feel for the how we might segment this group. Once we identify a segment profile, we can assign each person to the nearest profile.
This is almost exactly what K-Means does. It randomly picks "profiles" or seeds. Then it assigns each person to the nearest profile. And while there are smarter ways of selecting profiles, random is a good option to ideate with.
REMEMBER: People want to act on data. So create actionable segments. If the "right" clustering doesn't lead to a meaningful segments, it doesn't help. K-Means seems more apt for this than HDBSCAN.