//

Dashboards

Recruitment

How can we explore the social network structure of Github for better Recruitment of Developers?

US Open

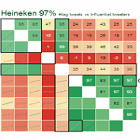
How did Heineken's social media marketing compare with Budweiser's during the US Open 2013?

Restaurant

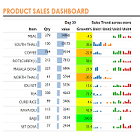
What products sell well at restaurants? How does this impact margin?

BPO

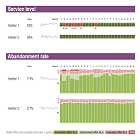
Perfomance of a BPO call center during the course of a day.

Company Size

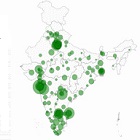
Analysis and Visualization of the employee strength and location of every company in India

Charts

Areaplot
0.2 0.4 0.6 0.8
Axis
Barchart
Zero-Barchart
Variwide
Boxplot
Bullet
-0.41067 11 F -0.86420 12 S 0.27504 13 S -0.28437 14 M 0.72808 15 T 0.30484 16 W -0.03294 17 T 0.12302 18 -0.16303 19 -0.88952 20 -0.60245 21 -0.83532 22 0.35352 23 0.77596 24 0.92158 25 0.48715 26 0.55395 27 -0.94169 28 0.04127 29 0.96877 30 0.16155 31 -0.83335 01 0.59119 02 0.83222 03 -0.37896 04 Aug 2025 0.35097 05 0.57017 06 -0.50926 07 -0.09253 08 -0.78766 09 0.03136 10 0.66574 11 0.74209 12 0.64724 13 0.02941 14 -0.37899 15 -0.10210 16 0.00896 17
Calendarmap
0.4 0.8 0.3 0.7
Cell-Bar
0.4 0.8 0.3 0.7
Cell-Gradient
-11 5 -22 X Y Z
Clusterplot
Diffbar
Dec Jan 24 25 26 27 28 31 01 02 03 04
Dateaxis
C A B D E F A-C: +39 +39 B-C: +nan +nan A-D: +66 +66 B-D: +nan +nan A-E: +31 +31 B-E: +55 +55 A-F: +nan +nan B-F: +55 +55
Heatgrid
C A B D E F A-C: +39 B-C: +nan A-D: +66 B-D: +nan A-E: +31 B-E: +55 A-F: +nan B-F: +55
Circlegrid
None None None None None None None None None None
Heatmap
Horizon
Icicle
Icons
Jitter
Metric 14.9 -3.2%
KPIBlock
Multiline
Pebbles
Radar
8 7 3 3 2 5 8 4 6 3
Radial
Radial Tree
Ribbon
C E D F 0 1 2 3 4 5 6 7 8 9 ('D', 4) ('C', 6) ('F', 1) ('E', 5) ('F', 5) ('C', 3) ('D', 3) ('C', 7) ('E', 6) ('D', 7) ('F', 4) ('C', 0) ('F', 2) ('F', 9) ('F', 8) ('C', 4) ('E', 7) ('E', 8) ('D', 6) ('C', 8) ('C', 1) ('D', 1) ('C', 5) ('D', 8) ('E', 0) ('E', 9) ('F', 6) ('E', 4) ('D', 0) ('C', 2) ('E', 1)
Sankey
Scatterplot
Sparkline
Stack
Streamgraph
Treemap
Sunburst
Tree
Cartogram
Choropleth