Help
The ATM dashboard gives you the time-wise and state-city snapshots of your ATM transactions.
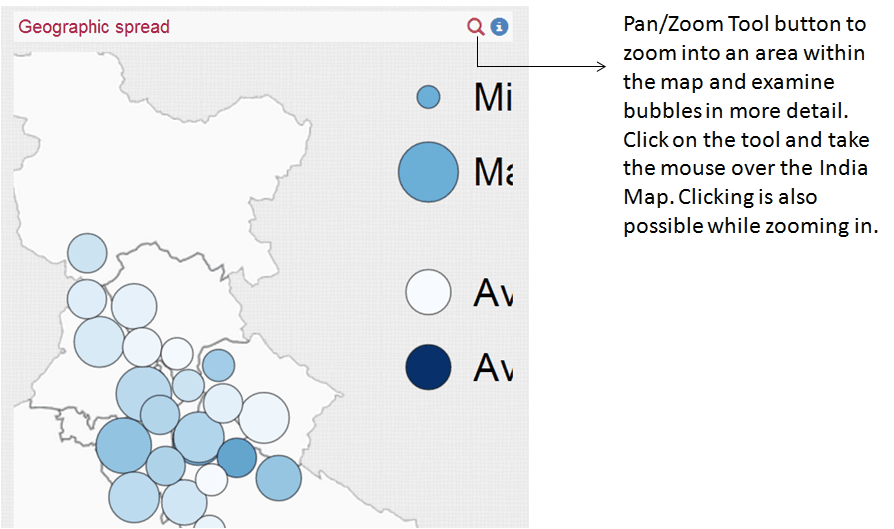
You can get answers to questions like what kind of transactions happen at what day of the month, time of the day. You can also get a geographical view of the ATM activity across the length and breadth of the country.
Dropdowns(left of the header)
First dropdown to the left on this header allows you to select the date for which the dashboard needs to be populated. Clicking on the dropdown gives you a calendar day-to-day view. Greener the day,more the value of the metric selected.
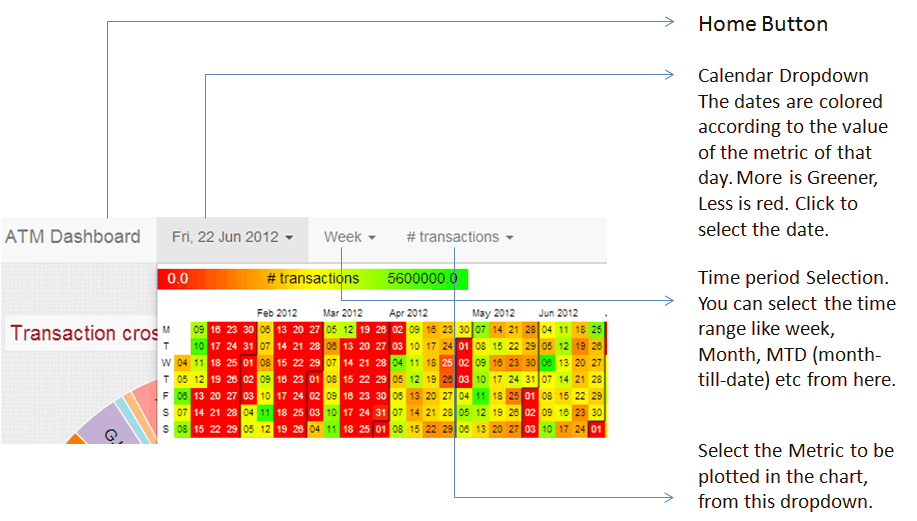
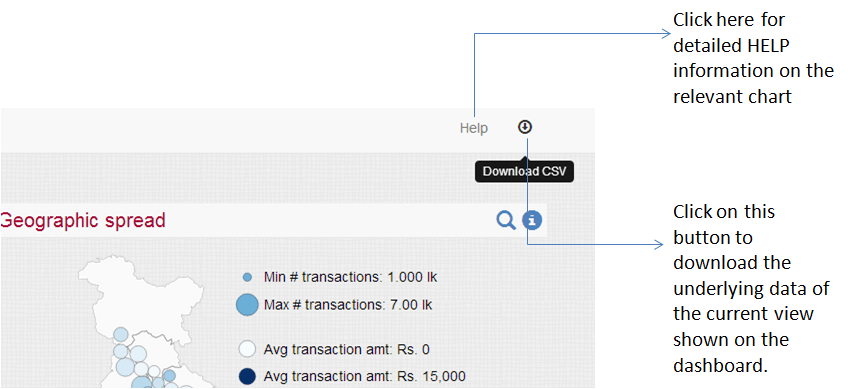
From the 2nd dropdown, you can select the duration from/to the date selected. To get a Weekly snapshot of ATM transactions, select "Week" from this dropdown and so on. From the 3rd dropdown, you can select the metric you want to be plotted on the dashboard, you can select either by the Amount Transacted or you can choose the no. of transaction. Download Button To the right of the header is the "Download CSV" button clicking on which will give you the underlying data for the current selection in the dashboard.
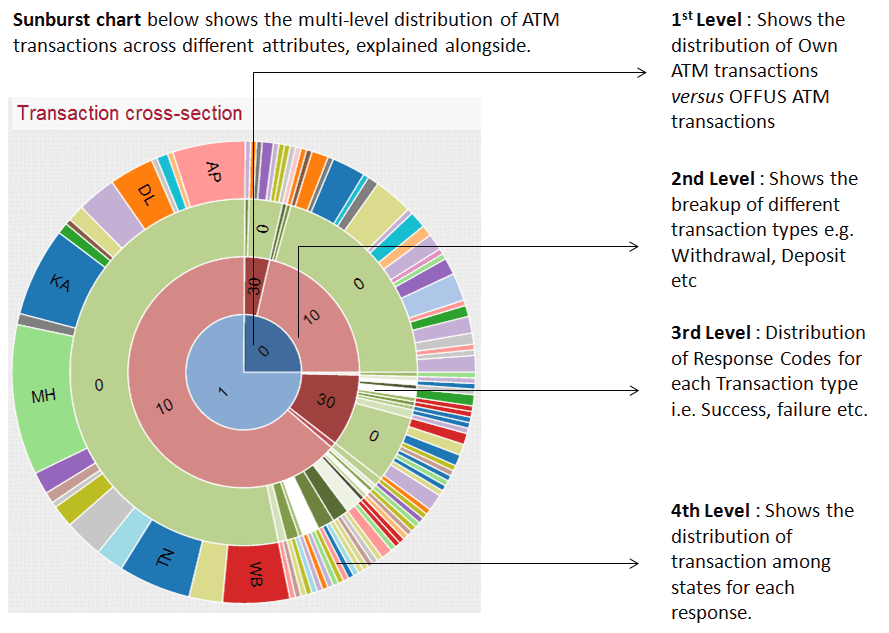
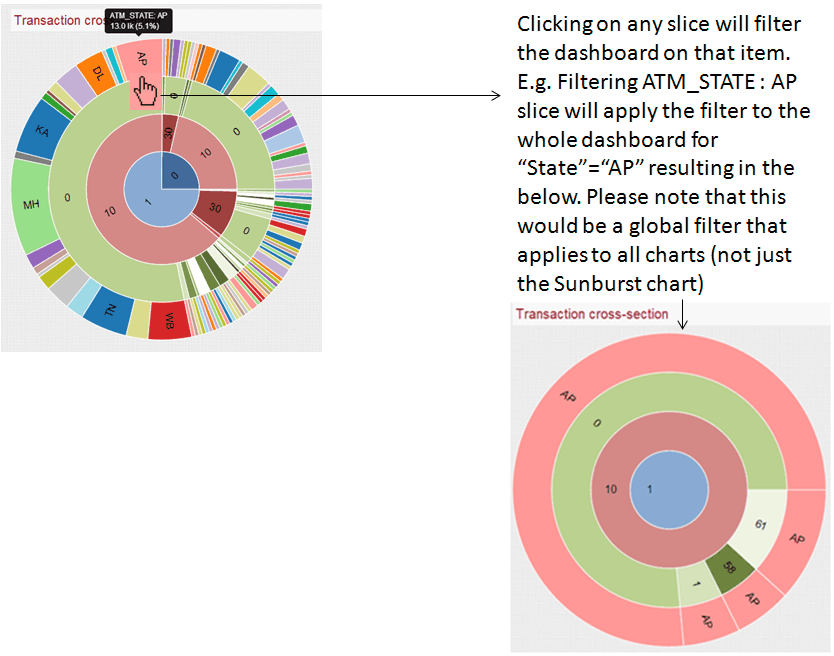
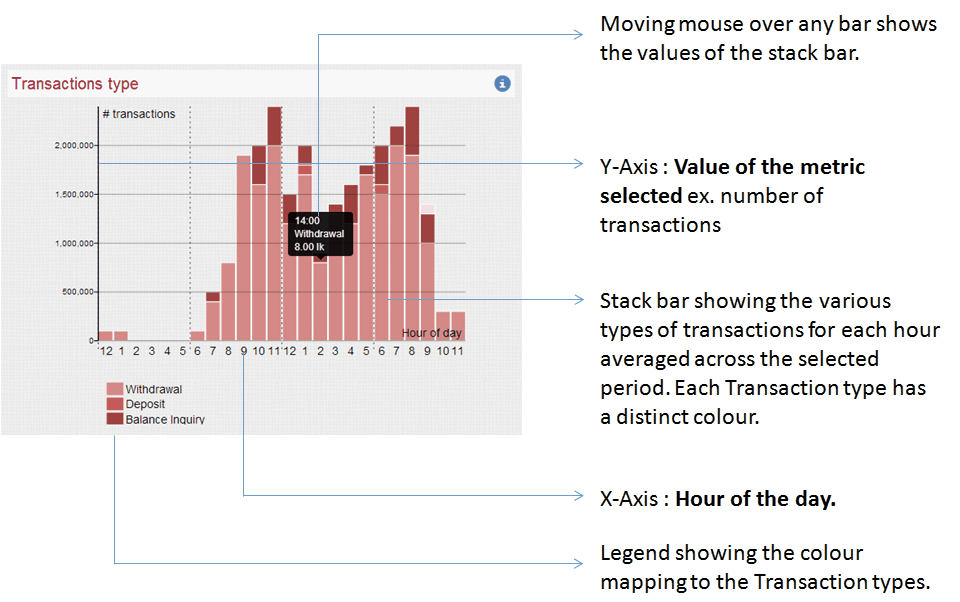
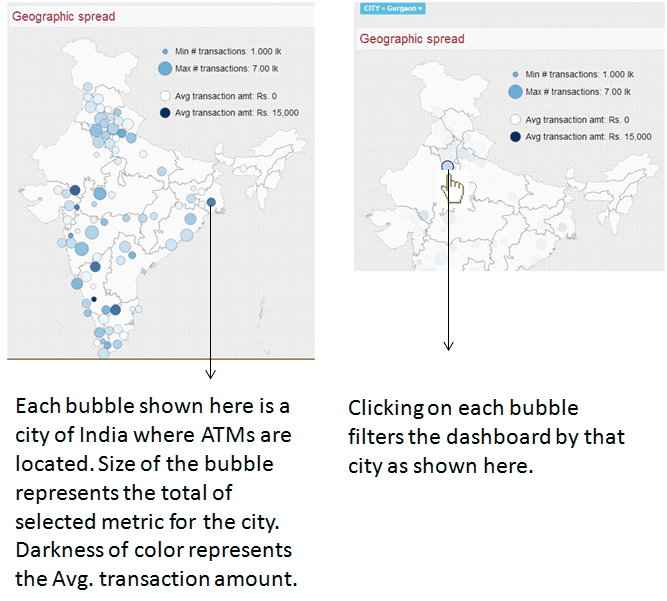
This dashboard is divided into three broad areas. Sunburst - (top-left) Gives you the hierarchical view of the no. of transactions. India Map - (top-right) Gives you the city-wise view of ATM activity MicroCharts - (bottom) Gives an aggregated hourly view of ATM transactions. Help for each chart is included for the respective areas. Click on the corresponding help to know how to use them.
From the 2nd dropdown, you can select the duration from/to the date selected. To get a Weekly snapshot of ATM transactions, select "Week" from this dropdown and so on. From the 3rd dropdown, you can select the metric you want to be plotted on the dashboard, you can select either by the Amount Transacted or you can choose the no. of transaction. Download Button To the right of the header is the "Download CSV" button clicking on which will give you the underlying data for the current selection in the dashboard.
This dashboard is divided into three broad areas. Sunburst - (top-left) Gives you the hierarchical view of the no. of transactions. India Map - (top-right) Gives you the city-wise view of ATM activity MicroCharts - (bottom) Gives an aggregated hourly view of ATM transactions. Help for each chart is included for the respective areas. Click on the corresponding help to know how to use them.