Contact Tracing About this app

How was it built?

Using Gramex – a low-code framework that builds data apps in a day.

This contact tracing application was built in 8 person-hours using data micro-services & components.

Network Data API

Gramex exposes network data via a SQL-to-REST micro-service, converting URL queries directly into SQL.

Fast Auto-Cache

Gramex implements an in-memory distributed cache. Any query that's run is auto-cached and served instantly.

Chart Components

Gramex Charts are ready-to-use interactive data visualizations that work in any application.

Data Narratives

Gramex lets you automate stories from data using narrative templates that render text based on data.

4 components replacing over 3,896 lines of code

3 weeks of effort reduced to 1 day

Try it. Download Gramex


Network Data API

Gramex exposes data from any database as a RESTful micro-service.

By adding this FormHandler configuration to a gramex.yaml file, it exposes a info about every node. For example:

You can connect directly to any data source — relational databases like Oracle, SQL Server or NoSQL data store like Spark, Neo4J, even Excel, and expose the data as a micro-service without code.

nodes-api:
  pattern: /nodes
  handler: FormHandler
  kwargs:
    url: sqlite:///contacts.db
    table: nodes
        
links-api:
  pattern: /links
  handler: FormHandler
  kwargs:
    url: sqlite:///contacts.db
    table: links
        

Fast auto-cache

Gramex can run any query or computation and expose it as a micro-service.

By adding this FunctionHandler configuration to a gramex.yaml file, it exposes the contact_tracing.contacts() function at contacts. For example:

This query can be slow. But since the data is updated only once a day, it can be cached for a day.

The caching mechanism can be applied on the server and the client side. Apart from duration-based caching, you can cache until data changes, or a table is updated, or any event or logic.

This runs the function contact_tracing.contacts() at contacts:

contacts:
    pattern: /contacts
    handler: FunctionHandler
    kwargs:
      function: contact_tracing.contacts
        

To cache it for a day, add this configuration:

    # Automatically cache this computation for a day
    cache:
      expiry:
        duration: 86400   # No. of seconds in a day
        

Chart Components

Gramex has a collection of pre-defined chart components that work well with any data structure.

By selecting and configuring your chart, you can export a code snippet such as the one alongside.

When you insert this to your HTML, renders the chart using the data you specify. The data is typically drawn from one of the APIs above.

<div class="chart"></div>
<script>
  draw({url: 'https://...chart-url.json', chart, {fontSize: '10'})
</script>
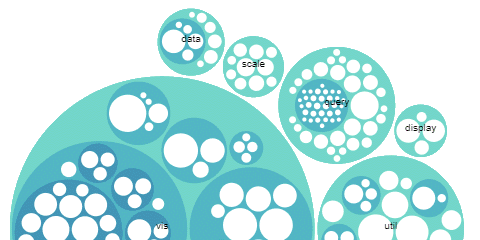
        
Nested circle packing chart output

Data Narratives

Gramex can convert data into narrative stories using templates.

By creating a FileHandler, you can render any text from data in a HTML, SVG, XML or markup file.

For example, the template on the right is used in the application when the user clicks on an employee. A sample output is Employee 12345 was in contact with 3 people under investigation at leat 8 times in the last 15 days.

Templates can be conditional. If a condition is true, we can state one thing. Else, we can state something else. For example, this template generates one of two outputs used in the title:

  • Employee 12345 was in contact with 32 others.
  • The top 50 people were contact with 338 others.

This data narrative explains each person's contact profile and spread.

Employee {{ query.id }} was in contact with {{ contacts.length }}
people under investigation
at least {{ query.min }} times
in the last {{ query.days }} days.

This data narrative generates the summary title of the app.

{% if query.id %}
  Employee {{ query.id }} was
{% else %}
  The top {{ query.limit }} people were
{% end %}
  in contact with {{ nodes.length }} others.

Try it. Download Gramex