About
Gramener works with Microsoft to deliver the power of visualisations on the Microsoft stack. The Gramener visualisation server works on Windows Server, with SQL Server as a database, and can be deployed on the cloud on Azure. The visuals can be viewed on Internet Explorer 11, as Windows 8 native applications, as well as in Microsoft Office — Excel, PowerPoint or Word.
In partnership with Microsoft, Gramener continues to create business applications that help make large volumes of data more easily consumable by managers. All of these applications are built to work on the Microsoft stack with the objective of showcasing the power of visualisations on the Microsoft platform.
Applications
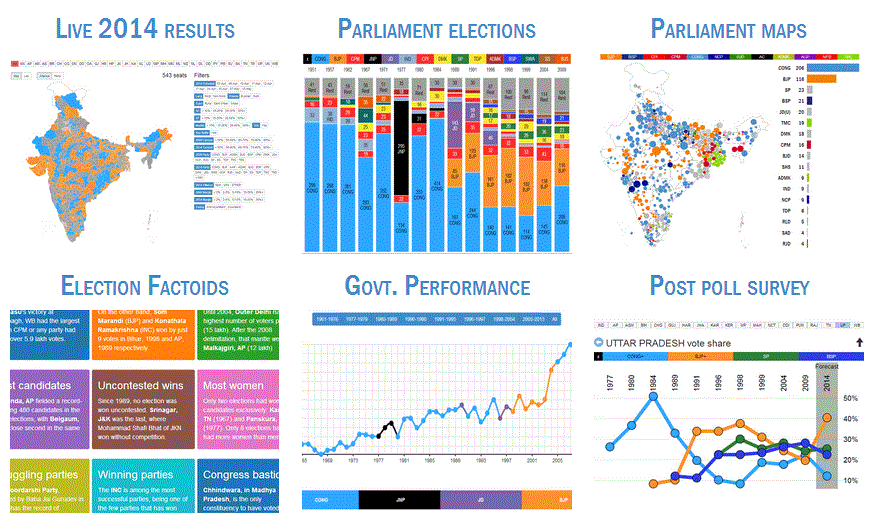
Elections
Gramener worked with Microsoft & CNN-IBN to deliver insights from 1951-2013 elections.
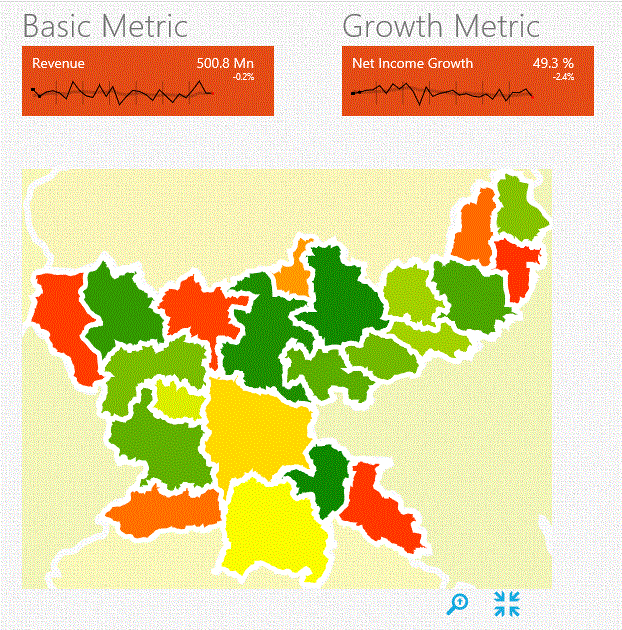
Banking
Allows to examine the geographic performance of every product in a bank all the way down to individual transactions.
GramExcel
GramExcel is a visualization plugin for Microsoft Excel which allows you to create unconventional charts as Treemap, word cloud, etc.
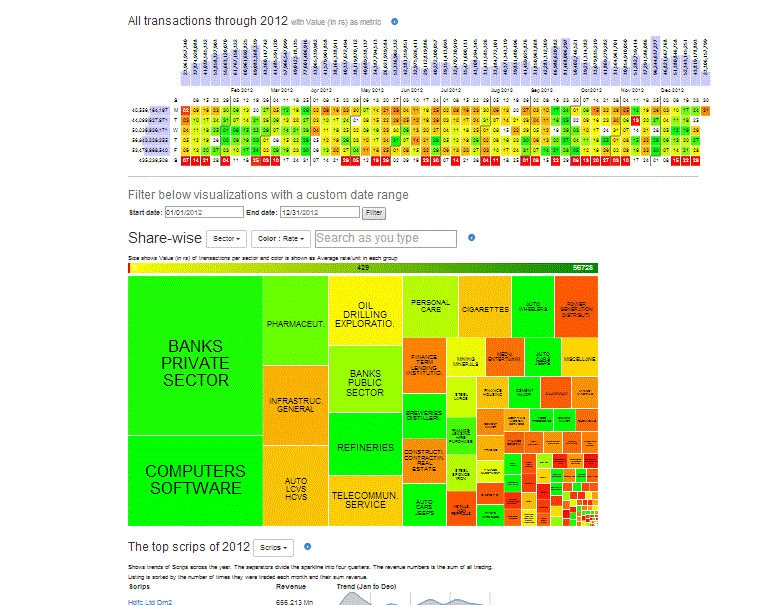
SEBI Factoids
Shows how FII transactions played over 10 years till 2013, across sectors.
Gramex web template
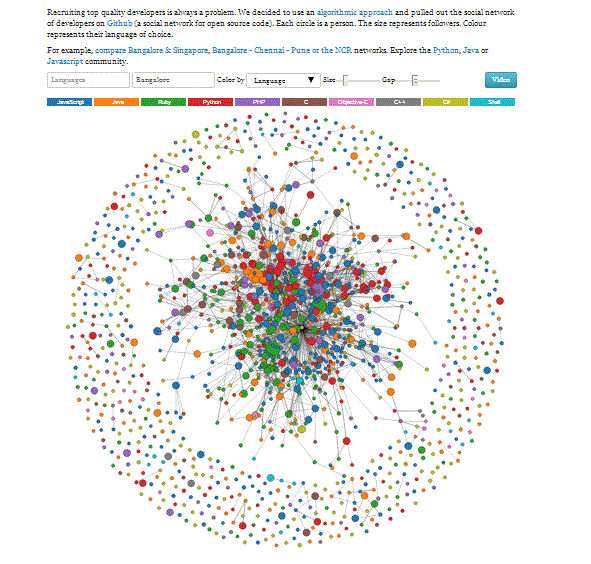
How can we explore the social network structure of Github for better Recruitment of Developers?
Budget
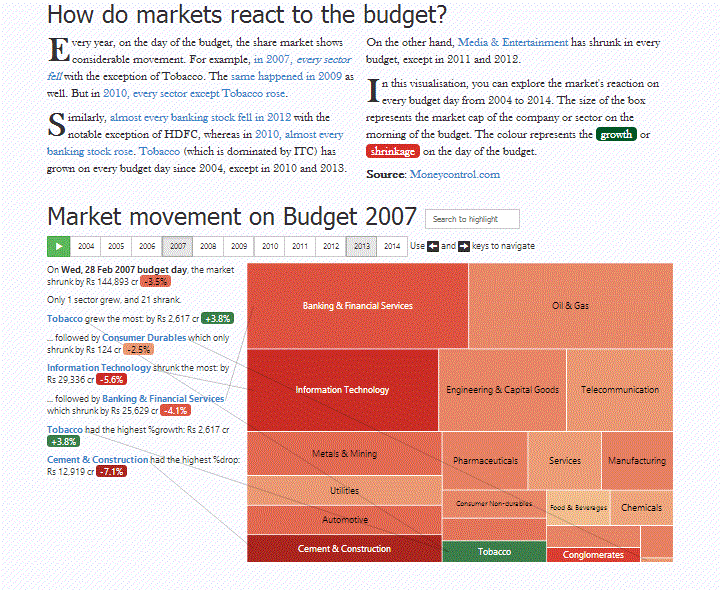
This application allows you to explore the market's reaction on every budget day from 2004-2014
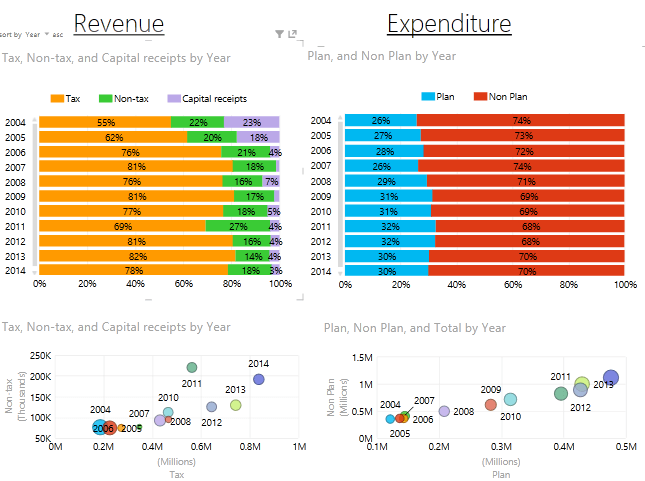
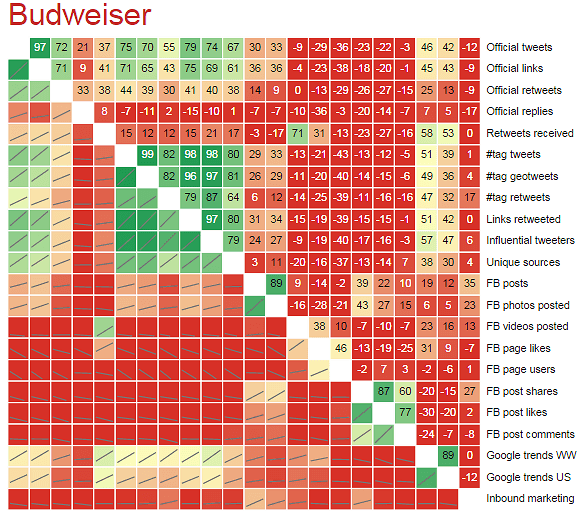
Power BI visuals
The visuals in Excel-PowerBI provide interesting insights and lets the user mine some intriguing stories.