Some Curated Insights


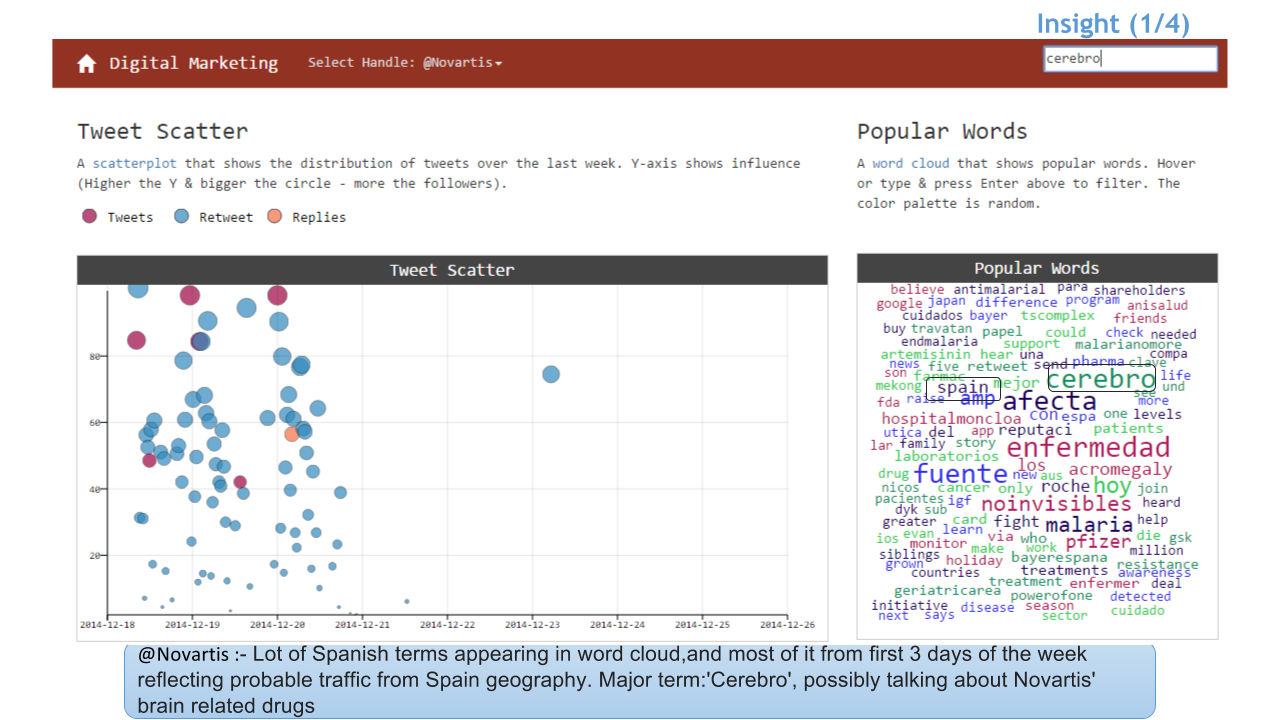
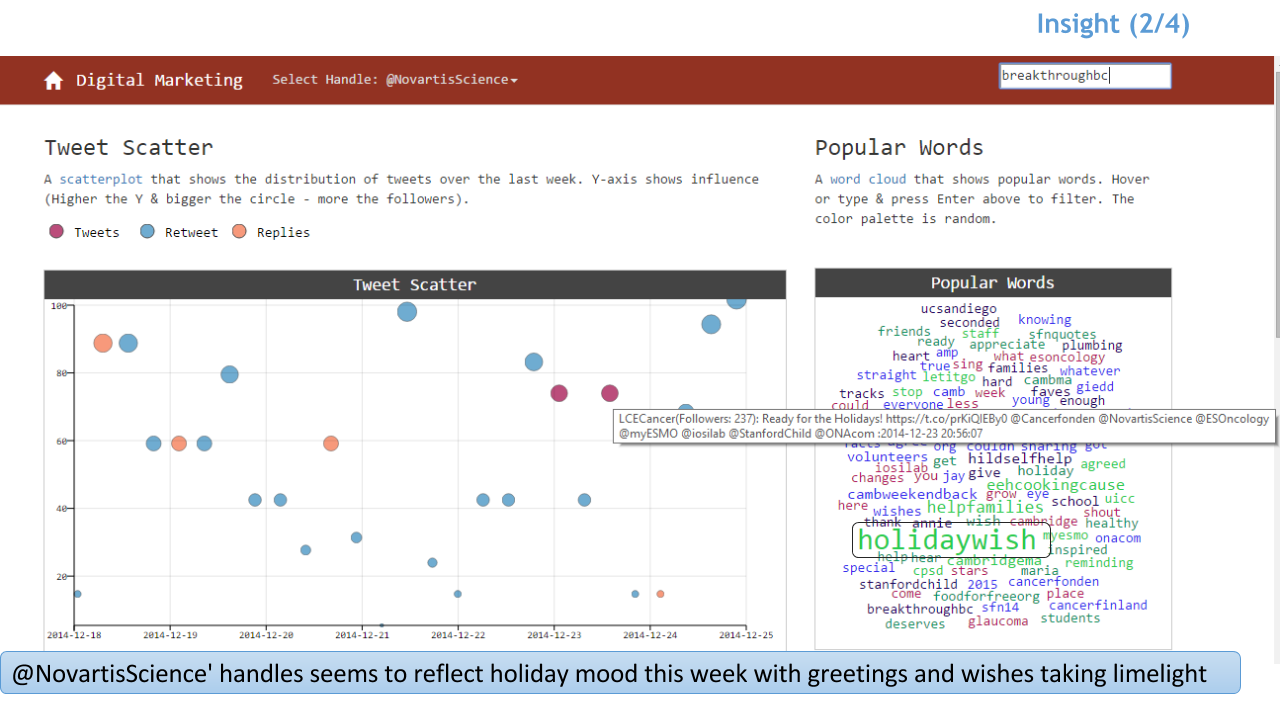
A scatterplot that shows the distribution of tweets over the last week. Y-axis shows influence (Higher the Y & bigger the circle - more the followers).
A word cloud that shows popular words. Hover or type & press Enter above to filter. The color palette is random.
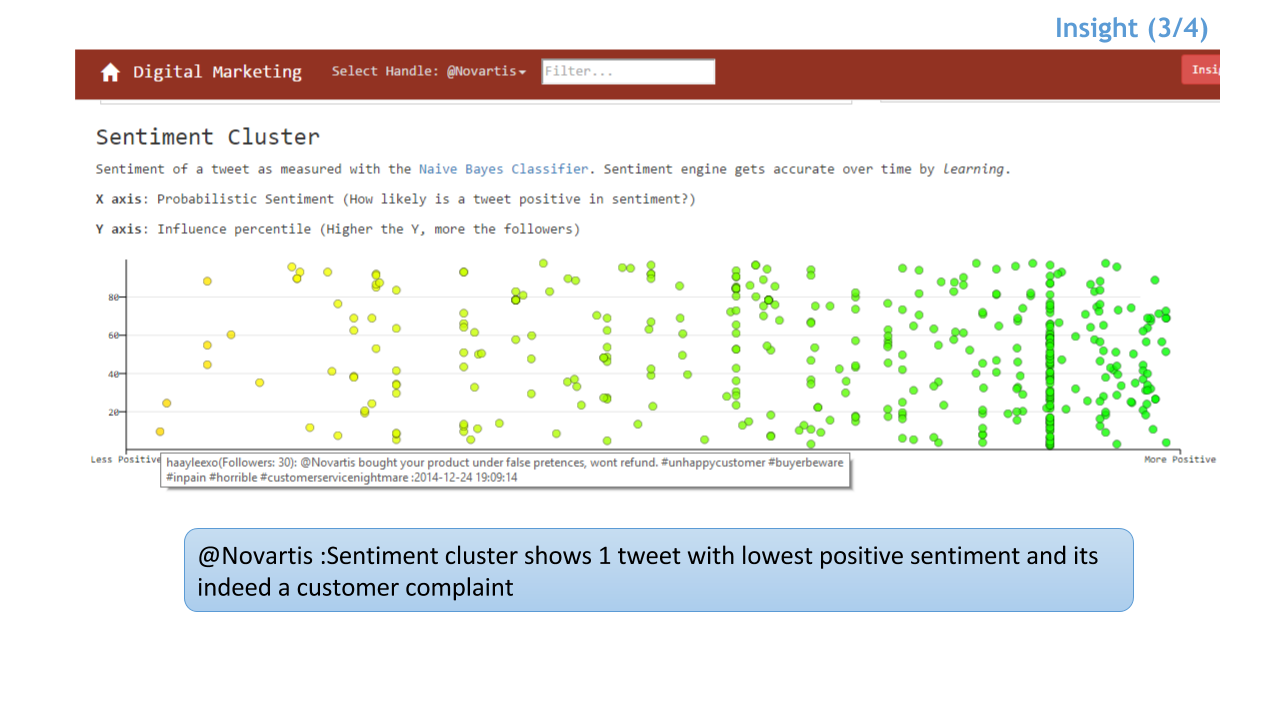
Sentiment of a tweet as measured with the Naive Bayes Classifier. Sentiment engine gets accurate over time by learning.
X axis: Probabilistic Sentiment (How likely is a tweet positive in sentiment?)
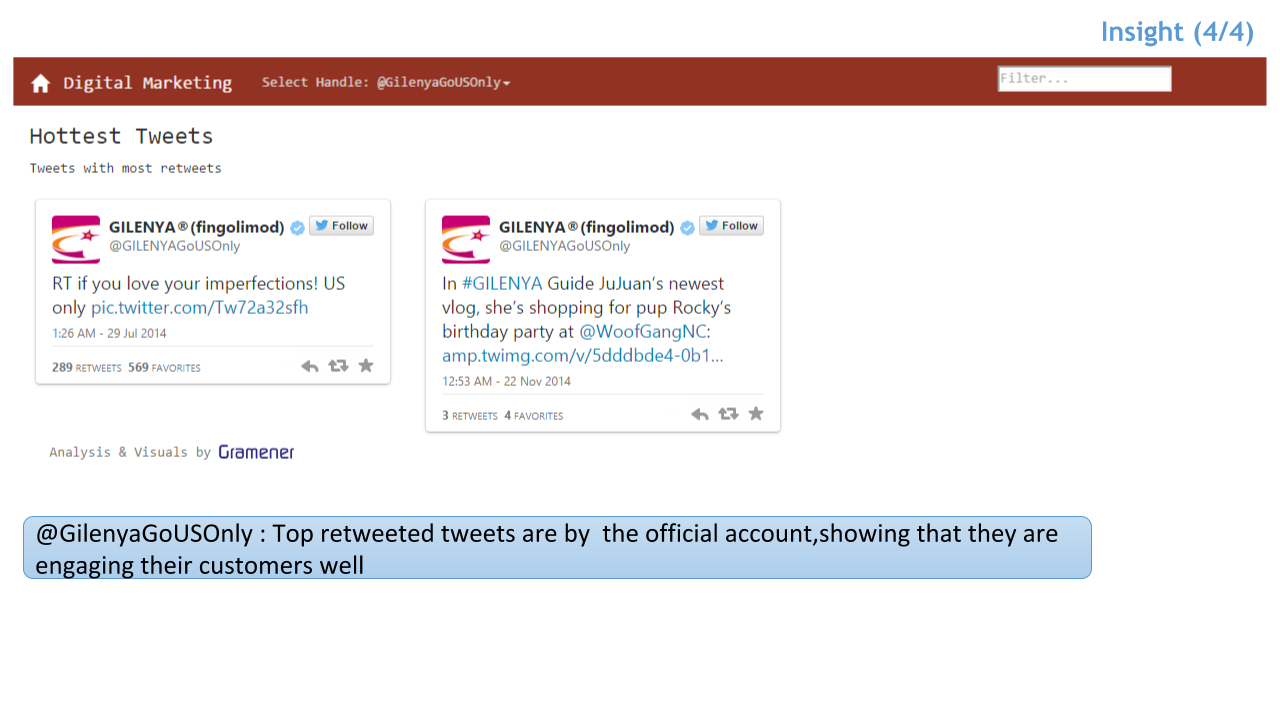
Y axis: Influence percentile (Higher the Y, more the followers)Tweets with most retweets
#Cosentyx can cause Crohns disease, in case y'all didn't know. @Novartis @COSENTYXUSOnly #ibd #Crohns #cosentyxcausescrohns #cosentyxcausesibd
— Global Nobody, shit just got REAL (@darthdaddy77) July 19, 2019
.@NoblePharma research manager is quoted in @DermTimesNow article on how #dermatologists are looking toward training devices for their patients as more #dermatology drugs require #selfinjection. Read the article here: https://t.co/9JM8ZnK84y #Dupixent #Cosentyx #Enbrel
— Noble (@NoblePharma) July 23, 2019