Log viewer
From v1.25, Gramex ships with a log file viewer.
To use it, add this to your gramex.yaml:
import:
  logviewer:
    path: $GRAMEXAPPS/logviewer/gramex.yaml # Source of the app
    YAMLURL: $YAMLURL/log/ # Location to mount at
    auth: ... # Restrict access as required
This configuration mounts the app at log/:
Try Log Viewer
Logviewer usage
Use LOGVIEWER_* variables to configure your app.
LOGVIEWER_DB: database to store logviewer data. Defaults to{url: sqlite:///$GRAMEXDATA/logs/logviewer.db}LOGVIEWER_PATH_UI: path to customized layout config. Use sample default$GRAMEXAPPS/logviewer/config.yamllayoutLOGVIEWER_PATH_RENDER: path to customized renderer config. Use sample default$GRAMEXAPPS/logviewer/render.jsjs fileLOGVIEWER_FORMHANDLER_KWARGS: to updateurl.name.kwargssectionLOGVIEWER_FORMHANDLER_QUERIES: to update or add toqueriessection of/$YAMLURL/query/formhandlerLOGVIEWER_CAPTURE_KWARGS: to pass additional kwargs to capture handlerLOGVIEWER_SCHEDULER_PORT: when running multiple instances of gramex, you can control to run scheduler only once from certain portLOGVIEWER_SCHEDULER_SETUP: to control frequency when to run the scheduler. Default: daily.LOGVIEWER_SCHEDULER_KWARGS: to changetransformsLOGVIEWER_CUSTOM_DIMENSIONS: to define custom columns and their value patterns
All variables are optional.
Logviewer database location
Logviewer stores data in a local SQLite database by default, at sqlite:///$GRAMEXDATA/logs/logviewer.db.
Distributed apps (e.g. load-balanced apps running on multiple servers) need logs stored centrally, e.g. on a database.
To store Logviewer data in MySQL, use:
import:
  logviewer:
    path: $GRAMEXAPPS/logviewer/gramex.yaml
    YAMLURL: $YAMLURL/log/
    LOGVIEWER_DB:
      url: mysql+pymysql://root@localhost/logviewer
To store Logviewer data in Postgres, use:
import:
  logviewer:
    path: $GRAMEXAPPS/logviewer/gramex.yaml
    YAMLURL: $YAMLURL/log/
    LOGVIEWER_DB:
      url: postgresql://postgres@localhost/test_formhandler
Note: Logviewer stores data in 3 tables:
aggD: daily aggregatesaggW: weekly aggregatesaggM: monthly aggregates
If you use a custom database or location for logviewer database, you need to specify the database in LOGVIEWER_FORMHANDLER_KWARGS:
import:
  logviewer:
    path: $GRAMEXAPPS/logviewer/gramex.yaml
    YAMLURL: $YAMLURL/log/
    LOGVIEWER_FORMHANDLER_KWARGS:
      url: mysql+pymysql://root@localhost/logviewer
Using Variables
Examples usage with LOGVIEWER_* variables
import:
  ui:
    path: $GRAMEXAPPS/ui/gramex.yaml
    YAMLURL: $YAMLURL/ui/
  logviewer:
    path: $GRAMEXAPPS/logviewer/gramex.yaml
    YAMLURL: $YAMLURL/log/
    LOGVIEWER_LAYOUT_KWARGS:
      auth: # Add auth to layout page
        login_url: /$YAMLURL/login
    LOGVIEWER_FORMHANDLER_KWARGS:
      headers:
        Cache-Control: public, max-age=3600 # cached for 1 hour
    LOGVIEWER_FORMHANDLER_QUERIES:
      kpi-pageviews: # overwrites existing query
        SELECT SUM(duration_count) AS value
        FROM {table} {where}
      kpi-custom-metric: # adds new query
        SELECT AVG(duration_count) AS value
        FROM {table} {where}
    LOGVIEWER_SCHEDULER_PORT: "9006" # run scheduler only on --listen.port=9006
    LOGVIEWER_PATH_UI: $YAMLPATH/logviewer-config.yaml # local .yaml file
    LOGVIEWER_PATH_RENDER: $YAMLPATH/logviewer-render.js # local js file
    LOGVIEWER_CAPTURE_KWARGS:
      timeout: 30 # Change timeout to 30
    LOGVIEWER_SCHEDULER_SETUP:
      minutes: 45 # Change minute to 45
    LOGVIEWER_SCHEDULER_KWARGS:
      transforms: # Add custom transforms, default transforms will be replaced
        - type: derive
          expr:
            col: user.id
            op: NOTIN
            value: ["-", "dev"]
          as: user.id_1
    LOGVIEWER_CUSTOM_DIMENSIONS:
      user_agent: df['headers.User-Agent'].str.extract(r"\((?P<user_agent>[^\(|\)]+)\)")
      slow: df['duration'] > 100
Multiple logviewer instances
When running multiple instances of the same app, each instance will start
log viewer. Avoid this by specifing LOGVIEWER_SCHEDULER_PORT: <one-port>. For example:
logviewer:
  path: $GRAMEXAPPS/logviewer/gramex.yaml
  YAMLURL: $YAMLURL/log/
  LOGVIEWER_SCHEDULER_PORT: "9001" # Run LogViewer only if the app is run on port 9001, not otherwise
Now, you can run the app on multiple ports. Only port 9001 will host the log viewer:
gramex --listen.port=9001     # Log viewer works here
gramex --listen.port=9002     # ... not here
gramex --listen.port=9003     # ... nor here
logviewer.db
Gramex logs all HTTP requests to logs/requests.csv under $GRAMEXDATA.
It logs:
time: Time of the request in milliseconds since epochip: The IP address of the client requesting the pageuser.id: The unique ID of the user requesting the pagestatus: The HTTP status code of the response (e.g. 200, 500)duration: Time taken to serve the request in millisecondsmethod: The HTTP method requested (e.g. GET or POST)uri: The full URL requested (after the host name)error: Any error raised while processing the request
Typical requests.csv looks like
1530008663609.0,::1,,200,2708.0,GET,/,
1530008665319.0,::1,,200,948.0,GET,/ui/jquery/dist/jquery.min.js,
1530008665404.0,::1,,200,81.0,GET,/script.js,
1530008665410.0,::1,,200,1.0,GET,/style.css,
1530008667319.0,::1,,404,678.0,GET,/favicon.ico,HTTPError: HTTP 404: Not Found
1530012727106.0,::1,user1,200,210.0,GET,/,
1530012729481.0,::1,,200,74.0,GET,/ui/jquery/dist/jquery.min.js,
1530012729538.0,::1,user2,200,1.0,GET,/script.js,
1530012729594.0,::1,,200,2.0,GET,/style.css,
By default, requests.csv are backed up on a weekly basis with date prefix.
For eg: requests.csv.2017-11-21.
Logviewer application uses data from logviewer.db for the front-end visuals.
logviewer.db stores the aggregated data (day (aggD), week (aggW), month (aggM)) tables of requests.csv*.
Data is grouped for every combination of (time (daily), user.id, ip, status, uri) and
aggregrated on (duration, new_session, session_time) metrics with (_count, _sum) suffix.
duration_count- Count of requests for given row combinationduration_sum- Sum of the requests’s time taken to serve the request in ms
Session Calculations
Every time a user logs into a gramex app, a new_session is flagged.
session_time duration (in seconds) is the length of time someone spends on the app.
For example, let’s take user1
user1logs in at10:00AMon page/page1- Does nothing for next few minutes
- Hits
/page2at10:05AM– right nowuser1‘s session_time is 5 minutes and counting. - By default, a 15-minute threshold is considered to flag
new_session. - Now the
user1comes back again at11:30AM - This request is flagged for
new_sessionandsession_timeis reset for this session.
Let’s take another scenario:
user2hits/page1at02:00PMuser2hits/page2at02:10PMuser2hits/page3at02:18PM- Total sessions by
user2is1andsession_timeis18mint
Session related metrics include:
new_session_sum- Total number of sessionssession_time_sum- Total time spent by the user on givenuriuser.idiptime:freqcombination
Note: You’d want to ignore test users, non-logged-in users [-, dev] for session related calulations.
As they tend to skew the session duration.
Currently, logviewer application having session related visuals, is based on following
kpi-avgtimespent: performsSUM(session_time_sum)/SUM(new_session_sum)kpi-sessions: performsSUM(new_session_sum)
You can customize kpi-avgtimespent to consider only logged-in users
import:
  logviewer:
    path: $GRAMEXAPPS/logviewer/gramex.yaml
    YAMLURL: $YAMLURL/log/
    LOGVIEWER_FORMHANDLER_QUERIES:
      kpi-avgtimespent:
        SELECT SUM(session_time_sum)/SUM(new_session_sum) AS value
        FROM {table}
        WHERE "user.id_1" == 1 {where}
user.id_1 by
default ignores ['-', 'dev'] users.
Customizing Logviewer
Let’s say we want to replace an KPI (Page Views) with custom KPI as below:
This can be achieved by following below steps.
Step 1:
First add the query for custom KPI to the gramex.yaml file as shown. You also need to configure the
LOGVIEWER_PATH_UI and LOGVIEWER_PATH_RENDER to point to the custom files as below.
logviewer:
  path: $GRAMEXAPPS/logviewer/gramex.yaml
  YAMLURL: $YAMLURL/log/
  auth:
    login_url: /$YAMLURL/google
    membership:
      - { hd: [gramener.com] }
  LOGVIEWER_FORMHANDLER_QUERIES: # add custom query
    kpi-customview: SELECT COUNT(duration_count) AS value
      FROM {table}
      WHERE uri_1 == 1 {where}

  LOGVIEWER_PATH_UI: $YAMLPATH/logviewer-config.yaml # use local config
  LOGVIEWER_PATH_RENDER: $YAMLPATH/logviewer-render.js # use local render
Step2:
In the file logviewer-config.yaml file (in your app folder) change the first list entry under the KPI as shown below:
From:
# KPIs
- "@class": d-flex flex-wrap my-4
  _$:
    [
      { "tpl": "lv-kpi", "on": "kpi-pageviews", "title": "Page Views" },
      { "tpl": "lv-kpi", "on": "kpi-sessions", "title": "Sessions" },
      { "tpl": "lv-kpi", "on": "kpi-users", "title": "Users" },
      {
        "tpl": "lv-kpi",
        "on": "kpi-avgtimespent",
        "title": "Avg.Session Time",
      },
      { "tpl": "lv-kpi", "on": "kpi-urls", "title": "URLs" },
      { "tpl": "lv-kpi", "on": "kpi-avgloadtime", "title": "Avg.Load Time" },
    ]
to:
# KPIs
- "@class": d-flex flex-wrap my-4
  _$:
    [
      { "tpl": "lv-kpi", "on": "kpi-customview", "title": "Custom KPI" },
      { "tpl": "lv-kpi", "on": "kpi-sessions", "title": "Sessions" },
      { "tpl": "lv-kpi", "on": "kpi-users", "title": "Users" },
      {
        "tpl": "lv-kpi",
        "on": "kpi-avgtimespent",
        "title": "Avg.Session Time",
      },
      { "tpl": "lv-kpi", "on": "kpi-urls", "title": "URLs" },
      { "tpl": "lv-kpi", "on": "kpi-avgloadtime", "title": "Avg.Load Time" },
    ]
This ensures that right query is called to fetch data from the tables.
Step 3:
To render this in the UI, we need to make changes in the logviewer-render.js
file (in your app folder) so that right visuals are displayed. To do that, in the
viewsConfig: list, change the first entry from:
   {
      type: 'kpi', url: 'query/aggD/kpi-pageviews/', on: '.kpi-pageviews',
      formatter: d3.format(',.2d')
    },
to:
    {
      type: 'kpi', url: 'query/aggD/kpi-customview/', on: '.kpi-customview',
      formatter: d3.format(',.2d')
    },
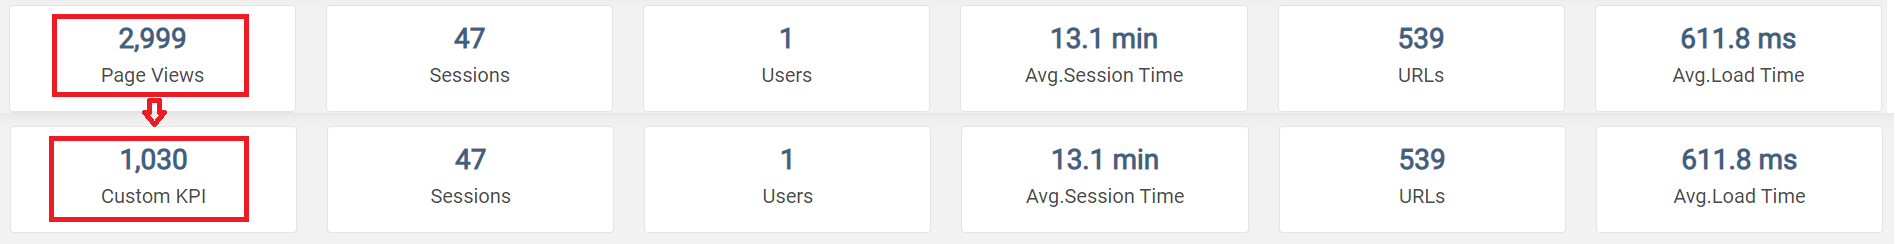
Refresh logviewer. You should see the Page Views KPI being replaced by the Custom KPI, like below:

You can add your own custom KPIs and Visuals. Add more queries to your gramex.yaml file as below:
logviewer:
  path: $GRAMEXAPPS/logviewer/gramex.yaml
  YAMLURL: $YAMLURL/log/
  auth:
    login_url: /$YAMLURL/google
    membership:
      - { hd: [gramener.com] }
  LOGVIEWER_FORMHANDLER_QUERIES: # add custom queries
    kpi-customview: SELECT COUNT(duration_count) AS value
      FROM {table}
      WHERE uri_1 == 1 {where}
    custloadtimetrend:
      SELECT time, SUM(duration_sum)/SUM(duration_count) AS loadtime
      FROM {table} {where}
      GROUP BY time
    custloadtimerequeststrend:
      SELECT time, SUM(duration_sum)/SUM(duration_count) AS loadtime,
      SUM(duration_count) AS requests
      FROM {table} {where}
      GROUP BY time

  LOGVIEWER_PATH_UI: $YAMLPATH/logviewer-config.yaml # use local config
  LOGVIEWER_PATH_RENDER: $YAMLPATH/logviewer-render.js # use local render
Now you should add corresponding entries for the above queries in your logviewer-config.yaml file. This can be done as shown below:
settings:
  # ... TODO: configure head, navbar, footer, script, style sections
render: $LOGVIEWER_PATH_RENDER
layout:
  section:
    # filters
    - "@class": filters bg-white shadow pt-2 pb-2
      div:
        - "@class": container-fluid px-0
          _$:
            {
              "tpl": "lv-filters",
              "values":
                [
                  { "on": "filter-time", "type": "daterange" },
                  {
                    "on": "filter-status",
                    "type": "select",
                    "name": "status",
                    "value": "Status",
                  },
                  {
                    "on": "filter-users",
                    "type": "select",
                    "name": "user.id",
                    "value": "User Name",
                  },
                  {
                    "on": "filter-uri",
                    "type": "select",
                    "name": "uri",
                    "value": "Page Name",
                  },
                  {
                    "on": "filter-ip",
                    "type": "select",
                    "name": "ip",
                    "value": "IP",
                  },
                ],
            }
    # KPIs
    - "@class": d-flex flex-wrap my-4
      _$:
        [
          { "tpl": "lv-kpi", "on": "kpi-pageviews", "title": "Page Views" },
          { "tpl": "lv-kpi", "on": "kpi-sessions", "title": "Sessions" },
          { "tpl": "lv-kpi", "on": "kpi-users", "title": "Users" },
          {
            "tpl": "lv-kpi",
            "on": "kpi-avgtimespent",
            "title": "Avg.Session Time",
          },
          { "tpl": "lv-kpi", "on": "kpi-urls", "title": "URLs" },
          {
            "tpl": "lv-kpi",
            "on": "kpi-avgloadtime",
            "title": "Avg.Load Time",
          },
          { "tpl": "lv-kpi", "on": "kpi-customview", "title": "Custom KPI" },
        ]
    # Heading
    - _$: { "tpl": "lv-header", "values": { "title": "Traffic Trend" } }
    - div:
        "@class": container-fluid pe-lg-0
        _$:
          {
            "tpl": "lv-card-deck",
            "values":
              [
                { "on": "vegam-pageviewstrend", "title": "Page Views" },
                { "on": "vegam-sessionstrend", "title": "Sessions" },
              ],
          }
    - _$: { "tpl": "lv-header", "values": { "title": "Top Metrics" } }
    - div:
        "@class": container-fluid pe-lg-0
        _$:
          - {
              "tpl": "lv-card-deck",
              "values":
                [
                  { "on": "vegam-toptenuri", "title": "Top URLs" },
                  { "on": "vegam-toptenusers", "title": "Top Users" },
                ],
            }
          - {
              "tpl": "lv-card-deck",
              "values":
                [
                  { "on": "vegam-toptenstatus", "title": "Top Status" },
                  { "on": "vegam-toptenip", "title": "Top IPs" },
                ],
            }
    - _$: { "tpl": "lv-header", "values": { "title": "Server Load" } }
    - div:
        "@class": container-fluid pe-lg-0
        _$:
          {
            "tpl": "lv-card-deck",
            "values":
              [
                {
                  "on": "vegam-loadtimetrend",
                  "title": "Server Response Time",
                },
                {
                  "on": "vegam-loadtimerequeststrend",
                  "title": "Response Time and Requests",
                },
              ],
          }
    - _$: { "tpl": "lv-header", "values": { "title": "Custom Metric" } }
    - div:
        "@class": container-fluid pe-lg-0
        _$:
          {
            "tpl": "lv-card-deck",
            "values":
              [
                {
                  "on": "vegam-custloadtimetrend",
                  "title": "Custom Metric Time",
                },
                {
                  "on": "vegam-custloadtimerequeststrend",
                  "title": "Custom Requests",
                },
              ],
          }
Similarly, you would need to add the code to render the output of the queries as visuals. For that you need to update your logviewer-render.js file as shown below:
/* globals d3 */
/* exported config */

var x_axis_format = "%d %b %Y";
var dt_axis_tickcount = { interval: "day", step: 1 };
var config = {
  filters: [
    {
      column: "status",
      type: "select",
      el: ".filter-status select",
      url: "query/aggD/filterstatus/",
    },
    {
      column: "user.id",
      type: "select",
      el: ".filter-users select",
      url: "query/aggD/filterusers/",
    },
    {
      column: "uri",
      type: "select",
      el: ".filter-uri select",
      url: "query/aggD/filteruri/",
    },
    {
      column: "ip",
      type: "select",
      el: ".filter-ip select",
      url: "query/aggD/filterip/",
    },
    { column: "time", type: "daterange", el: ".filter-time input", url: "" },
  ],
  viewsConfig: [
    {
      type: "kpi",
      url: "query/aggD/kpi-pageviews/",
      on: ".kpi-pageviews",
      formatter: d3.format(",.2d"),
    },
    {
      type: "kpi",
      url: "query/aggD/kpi-sessions/",
      on: ".kpi-sessions",
      keep: ["user.id", "time"],
      formatter: d3.format(",.2d"),
    },
    {
      type: "kpi",
      url: "query/aggD/kpi-users/",
      on: ".kpi-users",
      formatter: d3.format(",.2d"),
    },
    {
      type: "kpi",
      url: "query/aggD/kpi-avgtimespent/",
      on: ".kpi-avgtimespent",
      keep: ["user.id", "time"],
      formatter: function (v) {
        return d3.format(",.1f")(v / 60) + " min";
      },
    },
    {
      type: "kpi",
      url: "query/aggD/kpi-urls/",
      on: ".kpi-urls",
      formatter: d3.format(",.2d"),
    },
    {
      type: "kpi",
      url: "query/aggD/kpi-avgloadtime/",
      on: ".kpi-avgloadtime",
      formatter: function (v) {
        return d3.format(",.1f")(v) + " ms";
      },
    },
    {
      type: "kpi",
      url: "query/aggD/kpi-customview/",
      on: ".kpi-customview",
      formatter: d3.format(",.2d"),
    },
    {
      type: "viz",
      url: "query/aggD/pageviewstrend/",
      on: ".vegam-pageviewstrend",
      viz: [
        { data: null, options: { types: { time: "date" } } },
        {
          apply: "area",
          x: "time",
          y: "pageviews",
          props: { fill: "#c5e5f8" },
        },
        {
          apply: "line",
          x: "time",
          y: "pageviews",
          props: { stroke: "#186de5" },
        },
        {
          apply: "scatter",
          x: "time",
          y: "pageviews",
          mark: "circle",
          props: { fill: "#186de5", size: 50 },
        },
        {
          apply: "style",
          x_axis_format: x_axis_format,
          x_axis_tickCount: dt_axis_tickcount,
        },
      ],
    },
    {
      type: "viz",
      url: "query/aggD/sessionstrend/",
      on: ".vegam-sessionstrend",
      keep: ["user.id", "time"],
      viz: [
        { data: null, options: { types: { time: "date" } } },
        { apply: "area", x: "time", y: "sessions", props: { fill: "#cc95ff" } },
        {
          apply: "line",
          x: "time",
          y: "sessions",
          props: { stroke: "#8f65b5" },
        },
        {
          apply: "scatter",
          x: "time",
          y: "sessions",
          mark: "circle",
          props: { fill: "#8f65b5", size: 50 },
        },
        {
          apply: "style",
          x_axis_format: x_axis_format,
          x_axis_tickCount: dt_axis_tickcount,
        },
      ],
    },
    {
      type: "viz",
      url: "query/aggD/toptenuri/",
      on: ".vegam-toptenuri",
      viz: [
        { data: null },
        {
          apply: "bar",
          y: "uri",
          x: "views",
          order: "views",
          props: { fill: "#77b7f1" },
        },
        {
          apply: "style",
          y_sort_op: "sum",
          y_sort_field: "views",
          y_sort_order: "descending",
        },
      ],
    },
    {
      type: "viz",
      url: "query/aggD/toptenusers/",
      on: ".vegam-toptenusers",
      viz: [
        { data: null },
        {
          apply: "bar",
          y: "[user.id]",
          x: "views",
          order: "views",
          props: { fill: "#8f65b5" },
        },
        {
          apply: "style",
          y_sort_op: "sum",
          y_sort_field: "views",
          y_sort_order: "descending",
        },
      ],
    },
    {
      type: "viz",
      url: "query/aggD/toptenstatus/",
      on: ".vegam-toptenstatus",
      viz: [
        { data: null },
        {
          apply: "bar",
          y: "status",
          x: "requests",
          order: "requests",
          props: { fill: "#77b7f1" },
        },
        {
          apply: "style",
          y_sort_op: "sum",
          y_sort_field: "requests",
          y_sort_order: "descending",
        },
      ],
    },
    {
      type: "viz",
      url: "query/aggD/toptenip/",
      on: ".vegam-toptenip",
      viz: [
        { data: null },
        {
          apply: "bar",
          y: "ip",
          x: "requests",
          order: "requests",
          props: { fill: "#8f65b5" },
        },
        {
          apply: "style",
          y_sort_op: "sum",
          y_sort_field: "requests",
          y_sort_order: "descending",
        },
      ],
    },
    {
      type: "viz",
      url: "query/aggD/loadtimetrend/",
      on: ".vegam-loadtimetrend",
      viz: [
        { data: null, options: { types: { time: "date" } } },
        {
          apply: "line",
          x: "time",
          y: "loadtime",
          props: { stroke: "#ff8101" },
        },
        {
          apply: "scatter",
          x: "time",
          y: "loadtime",
          mark: "circle",
          props: { fill: "#ff8101", size: 50 },
        },
        {
          apply: "style",
          x_axis_format: x_axis_format,
          x_axis_tickCount: dt_axis_tickcount,
        },
      ],
    },
    {
      type: "viz",
      url: "query/aggD/loadtimerequeststrend/",
      on: ".vegam-loadtimerequeststrend",
      viz: [
        { data: null, options: { types: { time: "date" } } },
        { apply: "area", x: "time", y: "requests", props: { fill: "#cc95ff" } },
        { apply: "style", x_axis: null, y_axis_grid: false, n: -1 },
        {
          apply: "line",
          x: "time",
          y: "requests",
          props: { stroke: "#8f65b5" },
        },
        {
          apply: "scatter",
          x: "time",
          y: "requests",
          mark: "circle",
          props: { fill: "#8f65b5", size: 20 },
        },
        { apply: "style", x_axis: null, y_axis: null, n: -2 },
        {
          apply: "line",
          x: "time",
          y: "loadtime",
          props: { stroke: "#ff8101" },
        },
        {
          apply: "scatter",
          x: "time",
          y: "loadtime",
          mark: "circle",
          props: { fill: "#ff8101", size: 20 },
        },
        {
          apply: "style",
          x_axis_format: x_axis_format,
          x_axis_tickCount: dt_axis_tickcount,
          y_axis_grid: false,
          n: -2,
        },
        { apply: "resolve", scale_y: "independent" },
      ],
    },
    {
      type: "viz",
      url: "query/aggD/custloadtimetrend/",
      on: ".vegam-custloadtimetrend",
      viz: [
        { data: null, options: { types: { time: "date" } } },
        {
          apply: "line",
          x: "time",
          y: "loadtime",
          props: { stroke: "#ff8101" },
        },
        {
          apply: "scatter",
          x: "time",
          y: "loadtime",
          mark: "circle",
          props: { fill: "#ff8101", size: 50 },
        },
        {
          apply: "style",
          x_axis_format: x_axis_format,
          x_axis_tickCount: dt_axis_tickcount,
        },
      ],
    },
    {
      type: "viz",
      url: "query/aggD/custloadtimerequeststrend/",
      on: ".vegam-custloadtimerequeststrend",
      viz: [
        { data: null, options: { types: { time: "date" } } },
        { apply: "area", x: "time", y: "requests", props: { fill: "#cc95ff" } },
        { apply: "style", x_axis: null, y_axis_grid: false, n: -1 },
        {
          apply: "line",
          x: "time",
          y: "requests",
          props: { stroke: "#8f65b5" },
        },
        {
          apply: "scatter",
          x: "time",
          y: "requests",
          mark: "circle",
          props: { fill: "#8f65b5", size: 20 },
        },
        { apply: "style", x_axis: null, y_axis: null, n: -2 },
        {
          apply: "line",
          x: "time",
          y: "loadtime",
          props: { stroke: "#ff8101" },
        },
        {
          apply: "scatter",
          x: "time",
          y: "loadtime",
          mark: "circle",
          props: { fill: "#ff8101", size: 20 },
        },
        {
          apply: "style",
          x_axis_format: x_axis_format,
          x_axis_tickCount: dt_axis_tickcount,
          y_axis_grid: false,
          n: -2,
        },
        { apply: "resolve", scale_y: "independent" },
      ],
    },
  ],
};
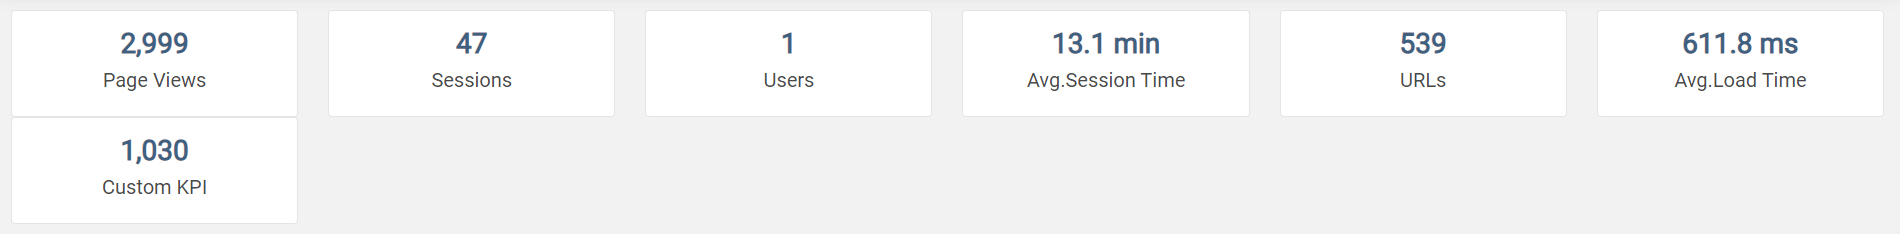
Refresh your logviewer url page. The KPIs should appear on top like this:
While the additional graphs at the bottom would be added as shown below:
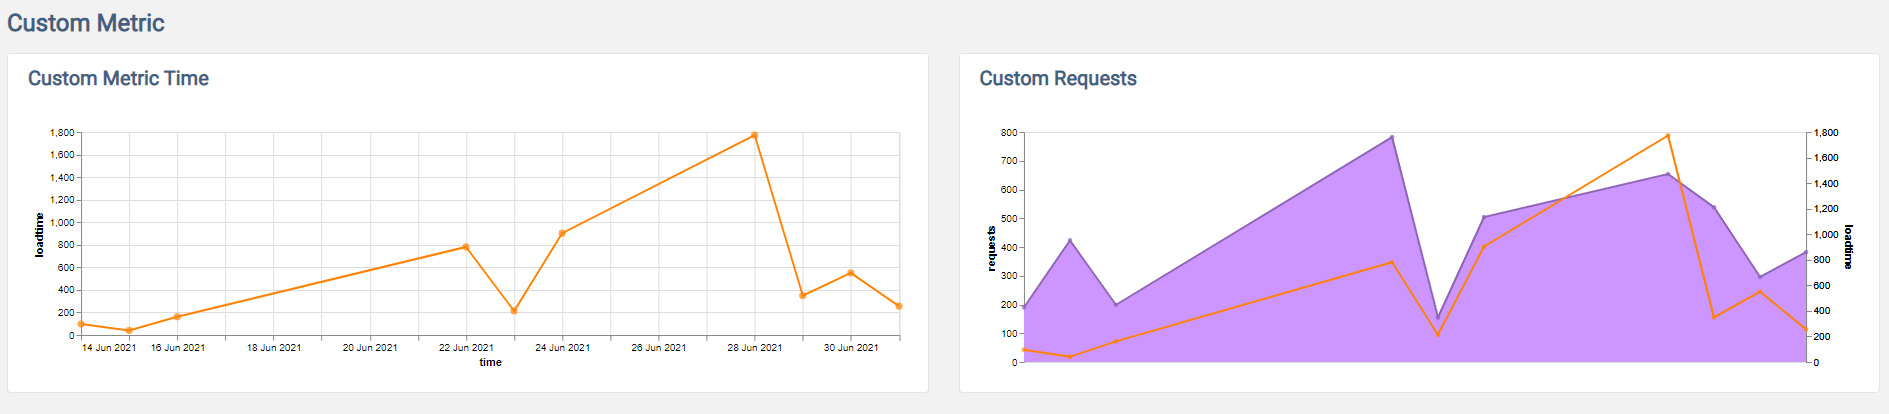
You can customize the cards to render visuals and graphs of your own choice.
You can copy source for logviewer-config.yaml and logviewer-render.js if they are not present in your app folder.
Add custom KPIs
v1.73. From Gramex version 1.73, you can log additional columns. For example, to log the browser.
Step 1:
Define custom column names and their formulas in gramex.yaml:
logviewer:
  LOGVIEWER_CUSTOM_DIMENSIONS:
    # Create a column called user_agent from the User-Agent header using regular expressions
    user_agent: df['headers.User-Agent'].str.extract(r"\((?P<user_agent>[^\(|\)]+)\)")
    # Create a boolean column called slow from the duration column
    slow: df['duration'] > 100
Step 2:
To use these columns on the logviewer page, add a custom query to gramex.yaml:
logviewer:
  path: $GRAMEXAPPS/logviewer/gramex.yaml
  YAMLURL: $YAMLURL/log/
  LOGVIEWER_FORMHANDLER_QUERIES:
    slow-loading-customview: SELECT COUNT(DISTINCT uri) AS value
      FROM {table}
      WHERE slow == 1 {where}
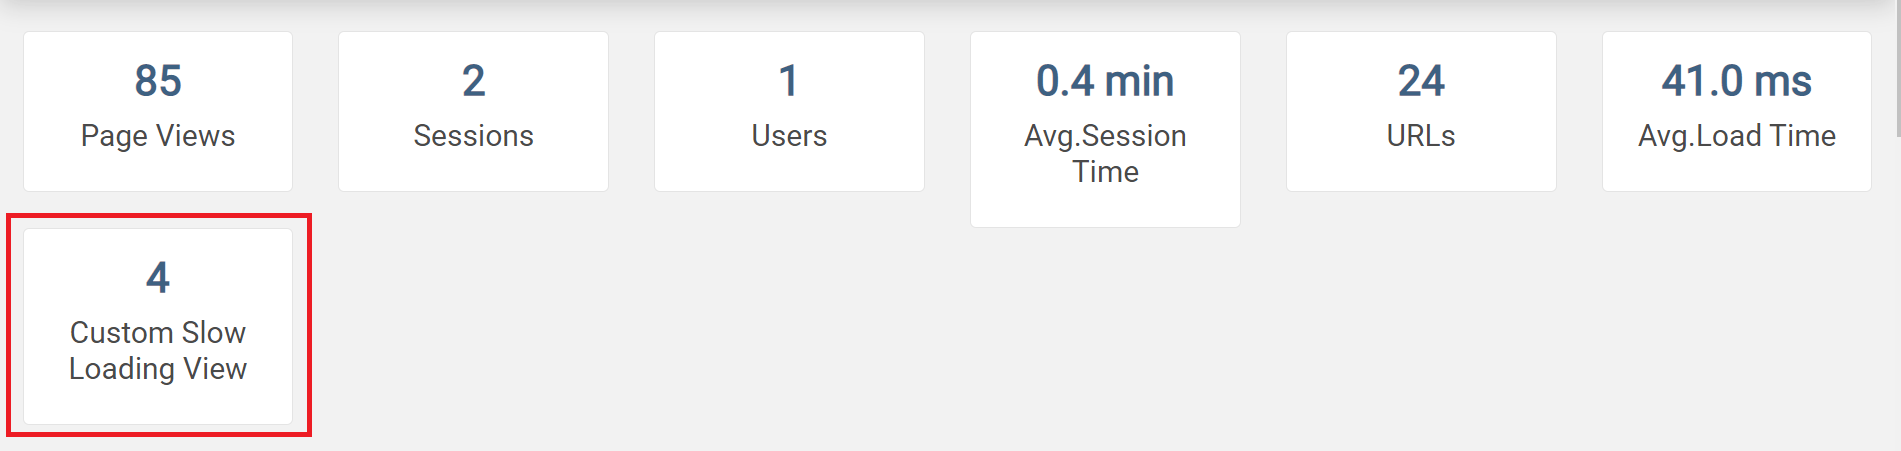
Now add the following to logviewer-config.yaml file:
- "@class": d-flex flex-wrap my-4
  _$: [
      ..., # Your existing parameters
      {
        "tpl": "lv-kpi",
        "on": "slow-loading-customview",
        "title": "Custom Slow Loading View",
      },
    ]
Similarly, add the following to logviewer-render.js file in the viewsConfig section:
viewsConfig: [
    ..., # Your existing parameters
    {
      type: "kpi",
      url: "query/aggD/slow-loading-customview/",
      on: ".slow-loading-customview",
      formatter: d3.format(',
      .2d'),
    },
  ]
The output would look like below.