PPTXHandler generates PPTX
PowerPoint presentations are the most common way businesses communicate data. Many, in fact, copy-paste screenshots from their BI tools into PowerPoint.
PPTXHandler makes it easy for users to:
- Automate slides from data (and embed it into their presentation)
- Edit the output by themselves
- Design or change the templates by themselves, without programming.
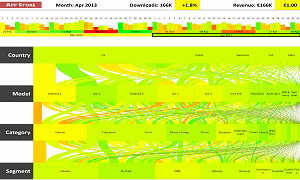
Here are examples of what PPTXHandler can create. Click to see details.


Learn using the SlideSense/PPTXHandler Tutorial videos.
Tutorials
Another way to learn is to pick an example you want to create, and follow the step-by-step tutorials.
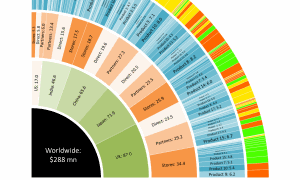
Bar chart race
Create a bar chart race in PowerPoint from data.
Rate of Entrepreneurship
Re-create a portion of the Kauffman Indicators of Rate of New Entrepreneurship in PowerPoint.
Causes of death
Re-create the Shifting Causes of Death visualization in PowerPoint.
Albus Dumbledore’s screen time
Discover Albus Dumbledore’s screen time in the Harry Potter movies with PowerPoint.
Color scales on maps
Create Choropleths (colored maps) by exploring the results of the US Presidential elections over time.
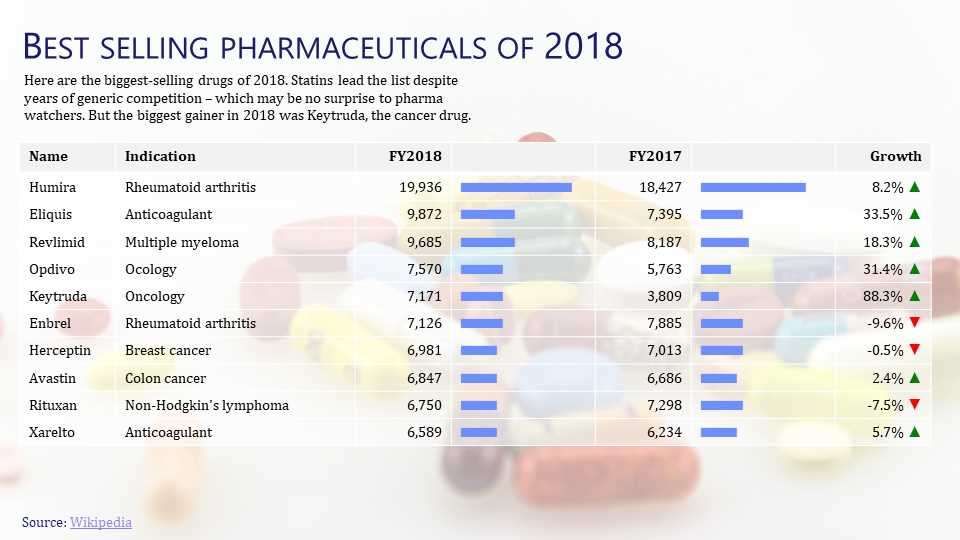
Bestselling Pharmaceutical Drugs
Visualize the Bestselling Pharmaceutical Drugs of 2017-18 data in PowerPoint.
About
There are two versions of PPTXHandler.
- Version 1 was introduced in v1.23. This is deprecated and no longer maintained.
- Version 2 was introduced in v1.61 is documented on this page.
Here is an example that shows how to change the text of a slide from data:
url:
  pptxhandler/sales-funnel:
    pattern: /$YAMLURL/output.pptx
    handler: PPTXHandler
    kwargs:
      version: 2 # Use PPTXHandler v2 instead of v1
      source: $YAMLPATH/template.pptx # Template to use
      data:
        products: { url: $YAMLPATH/products.yaml } # Load products data from products.yaml
      rules:
        - Visitors: # Find all shapes named 'Visitors'
            text: products['visitors'] # Replace text with value from data
          Leads:
            text: products['leads'] # Same for leads
          Cart:
            text: products['cart'] # ... and cart
      headers:
        Content-Disposition: attachment; filename=output.pptx
This takes the following PPTX as the source or template:
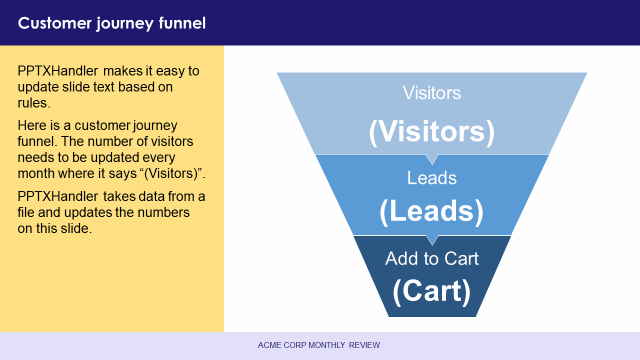
… and this dataset: products.yaml:
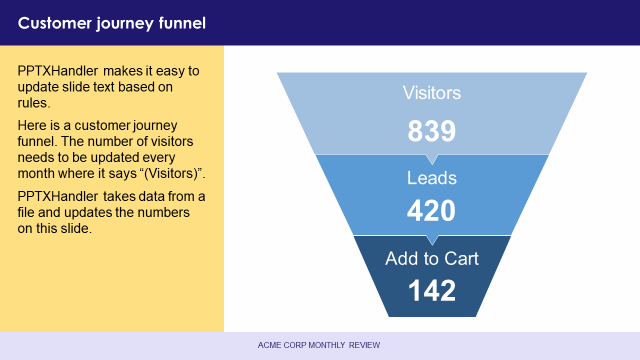
visitors: 839
leads: 420
cart: 142
… and creates this presentation:
Run the Sales Funnel example
Usage
PPTXHandler accepts a set of keys as kwargs. The most used keys are:
version: always set this to 2. Otherwise, PPTXHandler v1 is usedsource: path to the source or template PPTX, e.g.$YAMLPATH/source.pptxdata: dataset dictionary. Rules can use data to change slides. See how to specify the dataset, e.g.data: {products: {url: data.csv}}rules: list of rules to modify the source using data. See how to specify rules
Less used keys are:
target: path to save target PPTXunit: (optional) set the [unit of length][length] used by width, height, etc. See length unitmode: (optional) toggle whether value are expressions (default for PPTXHandler) or literals (default forpptgen())register: (optional) register custom commands. See how to register a new commandonly: (optional) slide number or list of slide numbers, starting from 1. All slides except these will be deleted- If
only=3, only the 3rd slide will be used - If
only=[3, 5, 6], only the 3rd, 5th and 6th slide will be used
- If
Command line
Run slidesense to run PPTXHandler from the command line. It renders any gramex.yaml in the
current folder, creating an output.pptx (or the file specified by target: in gramex.yaml).
It also opens the target PPTX in PowerPoint, if possible.
You can specify the path to your gramex.yaml, and also which PPTXHandler to run as the
command-line arguments. For example:
slidesense                      # Render first PPTXHandler in gramex.yaml
slidesense gramex.yaml my-url   # Render first PPTXHandler in gramex.yaml matching *my-url*
The second command above will render the 2nd PPTXHandler in this configuration:
url:
  first-pattern: ...
  my-url-pattern:
    pattern: ...
    handler: PPTXHandler
    kwargs: ...
Run slidesense config.yaml to render config.yaml with a simplified configuration that just
contains the kwargs of a PPTXHandler. Here is a sample config.yaml:
source: $YAMLPATH/template.pptx
rules:
  - Title 1: { text: New title }
You can override configurations by adding these options at the end:
--source=...overrides source PPTX path in config file--target=...overrides target PPTX path in config file (defaults to output.pptx)--data=...overrides data file in config path--no-opendon’t open target PPTX after generating it
Examples:
slidesense --source=my-template.pptx
slidesense config.yaml --target=my-output.pptx --no-open
slidesense gramex.yaml my-url --data=my-data.xlsx
Rules
A rule defines how to modify the source presentation. For example:
rules: # Apply these rules
  - Title 1: # Take the shape named "Title 1"
      text: f'Total sales is {sales["sales"].sum()}' # Replace text with data template
      fill-opacity: 0.5 # Make shape 50% transparent
  - Rectangle 1: # Take the shape named "Rectangle 1"
      fill: f'#ffff00' # Make its background yellow
A rule can pick one or more shape names, and apply one or more commands to each shape.
Shapes
Each rule in rules: is a dictionary of shape names.
All shapes in PowerPoint have names. To see them in PowerPoint, select Home tab > Drawing group > Arrange drop-down > Selection pane. Or press Alt + F10.
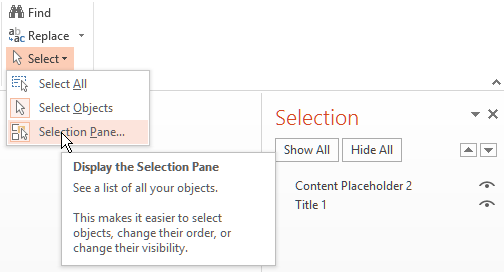
To change shape names, double-click on the name in the selection pane.
Shapes shouldn’t have the same name as commands, e.g. don’t name a shape “text”. Start shape names with a capital letter, e.g. “Text” instead of “text”.
You can use wildcards in a shape name. Use ? to match a single character, and * to match
anything. For example:
rules:
  - "TextBox ?": # Select TextBox 1, TextBox 2, ... but not TextBox 10, ...
      color: f'red' #     ... and set font color to red
  - "Text *": # Select ALL shapes starting with Text (case-sensitive)
      color: f'red'
  - "*box*": # Select ALL shapes with "box" anywhere in the text (case-sensitive)
      color: f'red'
You can also change the shape name with the name command, e.g. name: New TextBox. This is
particularly useful with the “morph” transitions, which matches shape names
beginning with !!. For example:
rules:
  - Bar:
      name: f'!!Bar' # Renames the shape "Bar" to "!!Bar"
      text: f'New text'
This ensures that the morph will match the shape even if it’s text changes. Source
Groups
Groups are shapes that contain other shapes. You can apply commands to the group itself (e.g. change its size or position), or to the shapes inside a group, like this:
rules:
  - Group 1: # Take the shape named "Group 1"
      left: 5 # Set the group's left position to 5 (inches)
      Caption: # Find the shape named "Caption" inside it
        text: f'New caption' #   Change its text to "New caption"
      Picture: # Find the shape named "Picture" inside it
        image: f'$YAMLPATH/sample.png' #   Replace the image with sample.png
Run the Groups example
Slide filters
By default, rules are applied to all slides. You can restrict changes to specific slides with:
slide-number: apply rule to specific slide numbers- e.g.
slide-number: 1picks only the 1st slide - e.g.
slide-number: [2, 4]picks the 2nd and 4th slide (not the 3rd)
- e.g.
slide-title: apply rule to specific slide titles- e.g.
slide-title: f'Business Update'picks all slides with the exact title “Business Update” (case-insensitive) - e.g.
slide-title: f'*Update*'picks all slides with “Update” anywhere in the title (case-insensitive) - e.g.
slide-title: f'Day ?'picks Day 1, Day 2, … but not Day 10, … - Use
?to match a single char, and*to match anything
- e.g.
For example:
source: input.pptx # optional path to source. Default to blank PPT with 1 slide
target: output.pptx # required path to save output as
rules:
  - slide-number: [2, 4] # Pick the 2nd and 4th slide (not the 3rd)
    Title: { text: f'X' }
  - slide-title: f'Business Update' # Pick the slide titled "Business Update" (case-insensitive)
    Title: { text: f'X' }
  - slide-title: f'Day ?' # Picks the slide titled "Day 1" or "Day 2", etc, not "Day 10"
    Title: { text: f'X' }
Transition
Add transition: to a rule to set the transition for all applicable slides.
For example:
rules:
  - transition: f'fade' # All slides have fade transition (0.3 seconds duration)
  - slide-number: 1 # Slide 1: Morph transition for 1.5s
    transition:
      type: f'morph'
      duration: 1.5
  - slide-number: 3 # Slide 3: Glitter - Diamonds from Left transition for 3s
    transition:
      type: f'glitter diamond left'
      duration: 3
  - slide-number: 4 # Remove all transitions from slide 4. Auto-advance in 2s
    transition:
      type: f'none'
      advance: 2
You can specify transitions by name (with space-separated options). The transition names and their
options are below, e.g. transition: f'airplane left', transition: f'fly-through in bounce'.
These are similar to PowerPoint’s UI.
none: (removes all transitions)airplane: left|rightblinds: horizontal|verticalbox: left|right|top|bottomchecker: horizontal|verticalcheckerboard: horizontal|verticalcircleclockclock-counterclockwisecomb: horizontal|verticalconveyor: left|rightcover: left|right|top|bottom|top-left|top-right|bottom-left|bottom-rightcrushcube: left|right|top|bottomcurtainscut: through-blackdiamonddissolvedoors: horizontal|verticaldrape: left|rightfade: through-blackfall-over: left|rightferris: left|rightflashflip: left|rightfly-through: in|out, bounceflythrough: in|out, bouncefracturegallery: left|rightglitter: diamond|hexagon, left|right|top|bottomhoneycombmorph: by-object|by-word|by-char (see note about using!!in shape names)newsflashorbit: left|right|top|bottomorigami: left|rightpage-curl-double: left|rightpage-curl-single: left|rightpan: left|right|top|bottompeel-off: left|rightpluspreset: left|right|top|bottomprestigeprism: left|right|top|bottompull: left|right|top|bottom|top-left|top-right|bottom-left|bottom-rightpush: left|right|top|bottomrandom-bars: horizontal|verticalrandomrandomBar: horizontal|verticalreveal: left|right, through-blackripple: top-left|top-right|bottom-left|bottom-right|centerrotate: left|right|top|bottomshape-circleshape-diamondshape-inshape-outshape-plusshred: strips|particles, in|outsplit: in|out horizontal|verticalstrips: top-left|top-right|bottom-left|bottom-rightswitch: left|rightuncover: left|right|top|bottom|top-left|top-right|bottom-left|bottom-rightvortex: left|right|top|bottomwarp: in|outwedgewheelwheelReversewind: left|rightwindow: horizontal|verticalwindows: horizontal|verticalwipe: left|right|top|bottomzoom-and-rotatezoom: in|out
You can also specify transitions as a dict with 3 keys:
type: transition name, followed by options, e.g.type: f'morph'duration: length of the transition in seconds (default:0.3seconds), e.g.duration: 3advance: auto-advance timeto the next slide, in seconds (default:f'none'), e.g.advance: 3
Run the Transition example
Copy slides
You can repeat a slide, changing the layouts or content based on data. This is used to:
- Show a report across time, e.g. copy the slide and change data across months
- Show a report across teams, e.g. copy the slide and change data across teams
- … across customers
- … across regions
- … across products, channels, and so on.
copy-slide: repeats the selected slides based on data. For example:
rules:
  - slide-number: 1
    copy-slide: [A, B, C]
    Title 1:
      text: f'Copy {copy.key} {copy.val}'
This repeats slide 1 three times, with titles “Copy 0: A”, “Copy 1: B” and “Copy 2: C”.
copy-slide: must be an expression that returns one of the following types. When
copying, the values of (copy.key, copy.val) are set as follows (just like
clone-shape:):
- tuple, list or pd.Index, e.g.
[x, y]🡆(0, 'x'), (1, 'y') - dict, e.g.
{x: 1, y: 2}🡆(1, 'x'), (2, 'y') pd.Series(['x', 'y'], index=[3, 4])🡆(3, 'x'), (4, 'y')pd.DataFrame({'x': row1, 'y': row2})🡆('x', row1)), ('y', row2)data.groupby('key')🡆 GroupBy iterator with group name and subsetted data
For each copied slide, the data variable copy is set. It has these attributes:
copy.pos: 0, 1, 2, … for each copied slidecopy.key: For lists or tuples, this is the same ascopy.pos. For dicts, Series, DataFrames, etc, it’s the key or indexcopy.val: Value corresponding tocopy.keycopy.slides: Currently copied PPTX slides list, e.g.copy.slides[0].shapes
Run the Bar Chart Race (copy-slide) example
Commands
Shapes can be changed using 1 or more commands. These commands can change the shape’s style and content, or add new content (like charts). Here are some common commands:
Position
top: sets top (Y) position in length units, e.g.top: f'3 inches'left: sets left (X) position in length units, e.g.left: f'3 inches'width: sets width in length units, e.g.width: f'3 inches'height: sets height in length units, e.g.height: f'3 inches'
Run the Position example
add-top: moves top (Y) position +/- in[length units](#length-units), e.g.add-top: f'-3 inches'add-left: moves left (X) position +/- in[length units](#length-units), e.g.add-left: f'+3 inches'add-width: adds width +/- in[length units](#length-units), e.g.f'add-width: -3 inch'add-height: adds width +/- in[length units](#length-units), e.g.f'add-height: +3 inches'
Run the Add Position example
rotation: sets the rotation in angles, e.g.rotation: 30add-rotation: adds the rotation in angles, e.g.rotation: -30zoom: increases/decreases width & height around the center, e.g.zoom: 1.2increases the size to 120%,zoom: 0.6shrinks it to 60% around the centeradjustment1: sets 1st shape adjustmentadjustment2: sets 2nd shape adjustmentadjustment3: sets 3rd shape adjustmentadjustment4: sets 4th shape adjustment
Style
fill: sets fill (background) color, e.g.fill: f'red'stroke: sets line color, e.g.stroke: f'red'fill-opacity: sets fill transparency on solid color fills. 0 is transparent, 1 is opaque, e.g.fill-opacity: 0.5is half transparentstroke-opacity: sets line transparency on solid color strokes. 0 is transparent, 1 is opaque, e.g.stroke-opacity: 0.5is half transparentstroke-width: sets width of the line in length units, e.g.stroke-width: f'0.5 pt'
Run the Groups example to understand styles
Image
image: set image of a picture to a file or URL, e.g.image: new-pic.pngorimage: https://picsum.photos/200. Retains aspect ratio, width and position. May change the heightimage-width: sets width in length units, e.g.image-width: 3 inches. Retains aspect ratio and position (top and left). May change the heightimage-height: sets height in length units, e.g.image-height: 3 inches. Retains aspect ratio and position (top and left). May change the width
Run the Clone Shape example to understand images
Link
link: on click, shape opens another slide, file or URL, e.g.link: 4,link: f'https://gramener.com/'hover: on hover, shape opens another slide, file or URL, e.g.link: 4,link: f'https://gramener.com/'tooltip: adds a text tooltip, e.g.f'Title text'. Does not work withhover: f'back'norlink: f'back'
link and hover can be specified as a:
- slide number, e.g.
link: 4. Values can be any slide number starting from 1 - slide reference, e.g.
link: f'first'. Values can befirst,last,next,prev(alias:previous),back(for last viewed slide), orend(for end show). - file, e.g.
link: f'new.pptx' - URL, e.g.
link: f'https://gramener.com/' noaction. This removes any prior link or hover on the shape
Run the Link example
Text
text: sets the shape’s text and format, e.g.text: f'<p><a italic="y">New</a> <a bold="y">text</a></p>'replace: updates the shape’s text and format, e.g.replace: {old: f'new', (rabbit|fox): f'<a color="red">animal</a>'}.- Replace only works within a run, i.e. for words that have the same formatting. For example, in “somewhere“, “where” is underlined. You cannot replace “somewhere”. But you can replace “some” and “where” independently.
bold: makes the text bold or normal. It can be true/yes/y/1 or false/no/n/0/”“, e.g.bold: truecolor: sets the text color in color units, e.g.color: f'red'font-name: sets the font name. It can be Arial, Calibri, or any valid font name, e.g.font-name: f'Arial'font-size: sets the font size in length units, e.g.font-size: f'18 pt'italic: makes the text italicized or normal. It can be true/yes/y/1 or false/no/n/0/”“, e.g.italic: trueunderline: underlines the text or makes it normal. It can be true/yes/y/1 or false/no/n/0/”“, e.g.underline: true
Run the Text example
Run the Certificate example
Text format
The text for text: may include <p> tags for for paragraphs, which may contain <a>
tags for runs. Similarly, the new text for replace: may include a single <a> tags for
the run. (These look like HTML, but they’re not.)
Paragraphs (<p>) can have attributes like <p align="right" level="2">. Valid attributes are:
align=sets the horizontal alignment. It can be left, center, right, justify, justify_low, (justify with low word spacing), distribute (for Japanese characters), thai_distribute, e.g.align="right"level=sets the indentation level number from 0 (default) to 8, e.g.level="2"line-spacing=sets the line spacing in length units, e.g.line-spacing="3 pt"space-after=sets the space after the paragraph in length units, e.g.space-after="18 pt"space-before=sets the space before the paragraph in length units, e.g.space-before="18 pt"
Runs (<a>) can have attributes like <a href="https://gramener.com/" bold="y" italic="y">. Valid attributes are:
baseline=moves text up or down. It can besuperscript,subscript, or any percentage, e.g.baseline="-25%",baseline="subscript"bold=makes the text bold or normal. It can be true/yes/y/1 or false/no/n/0/”“, e.g.bold="y"color=sets the text color in color units, e.g.color="red"font-name=sets the font name. It can be Arial, Calibri, or any valid font name, e.g.font-name="Arial"font-size=sets the font size in length units, e.g.font-size="18 pt"hover=sets the hover link, e.g.hover="back"orhover="3"italic=makes the text italicized or normal. It can be true/yes/y/1 or false/no/n/0/”“, e.g.italic="y"link=sets the hyperlink, e.g.link="back"orlink="3"strike=adds a strikethrough. It can besingle,doubleornone, .e.gstrike="single"tooltip=sets the tooltip, e.g.tooltip="Tooltip text"underline=underlines the text or makes it normal. It can be true/yes/y/1 or false/no/n/0/”“, e.g.underline="y"
You can’t use <p> inside another <p>, nor an <a> inside another <a>. If you do, the previous
tag is closed.
Note: Don’t use run attributes (like bold=, color=) on paragraphs. They work on paragraphs, but
are over-ridden by run attributes. E.g. If your source PPTX had a bold run, setting bold: n on
the para has no visible effect, since the bold run overrides it.
Run the Text Format example
Table
To update table text or style using data, use the table: command. Example:
data:
  products: {url: $YAMLPATH/products.csv}
rules:
  - Table 1:
      table:                                          # Apply table command
        data: products.head(10)                       # Show top 10 rows from products dataset
        text:
          Sales: f'<p>{cell.val:.0} $mn</p>'          # Format sales column as $mn
          Margin: f'<p>{cell.val:0.1%}</p>'           # Format margin column as %
        fill: 'red' if cell.row.Margin < 0 else 'green'   # Negative margin rows are colored red
The table: command supports these sub-commands:
data: sets the table’s shape using a DataFrame,e.g. data: pd.read_excel('data.xlsx'). (Lists, dicts, etc won’t work)- The PPTX table will have the same number of rows and columns as the
data. You still need to set cell text usingtext:below - If
datahas more rows, the last PPTX table row is cloned to add rows. Same for columns - If
datahas less rows, the last PPTX table rows are deleted. Same for columns - If
datais not specified, it’s auto-populated from the PPTX table text
- The PPTX table will have the same number of rows and columns as the
header-row: turns header row on or off, e.g.header-row: false- If
header-rowis a list, it sets the header row text, e.g.header-row: ['Sales', None, 'Growth <a sub="y">%</a>'].Noneretains the existing header
- If
total-row: turns special formatting for last row on or off, e.g.total-row: truefirst-column: turns special formatting for first column on or off, e.g.first-column: truelast-column: turns special formatting for last column on or off, e.g.last-column: true
You can set each cell’s properties with these sub-commands:
text: sets each cell’s text and format, e.g.text: f'<p><a italic="y">{cell.val}</a> <a bold="y">$ mn</a></p>'. By default, this just displays the data value. This is the same astext: cell.valalign: sets the horizontal alignment. It can be left, center, right, justify, justify_low, (justify with low word spacing), distribute (for Japanese characters), thai_distribute, e.g.align: rightbold: makes the text bold or normal. It can be true/yes/y/1 or false/no/n/0/”“, e.g.bold: truecolor: sets the text color in color units, e.g.color: f'red'fill: sets fill (background) color, e.g.fill: f'red'fill-opacity: sets fill transparency on solid color fills. 0 is transparent, 1 is opaque, e.g.0.5is half transparentfont-name: sets the font name. It can be Arial, Calibri, or any valid font name, e.g.font-name: f'Arial'font-size: sets the font size in length units, e.g.font-size: f'18 pt'italic: makes the text italicized or normal. It can be true/yes/y/1 or false/no/n/0/”“, e.g.italic: trueunderline: underlines the text or makes it normal. It can be true/yes/y/1 or false/no/n/0/”“, e.g.underline: truevertical-align: sets the vertical alignment. It can be top, middle, or bottom, e.g.vertical-align: middle
You can set the above cell properties either with a single expression, or an expression per column:
rules:
  - Table 1:
      table:
        # You can set every cell's property with an expression.
        # E.g. this makes every row red if the "Margin" column is negative, else it's green
        fill: 'red' if cell.row.Margin < 0 else 'green'
        # You can set a column's property with an expression, too.
        # E.g. this formats the Sales column and Margin column differently
        text:
          Sales: f'<p>{cell.val:.0} $mn</p>'          # Format sales column as $mn
          Margin: f'<p>{cell.val:0.1%}</p>'           # Format margin column as %
For each cell, the data variable cell is set. It has these attributes:
cell.val: value of each cellcell.index: DataFrame index of the cellcell.column: DataFrame column name of the cellcell.row: row that contains the current cell (as a Series)cell.data: DataFrame that contains the current cellcell.pos.row: row numbercell.pos.column: column numbercell.cell: currently rendered PPTX cell object, e.g.cell.cell.text
Run the Table example
Chart
To update a chart’s data, use the chart-data: command. Example:
data:
  products: { url: $YAMLPATH/products.csv }
rules:
  - Chart 1:
      chart:
        data: products.set_index('Name')
The chart: command supports these sub-commands:
data: sets the chart’s data using a DataFrame,e.g. data: pd.read_excel('data.xlsx'). (Lists, dicts, etc won’t work)- Charts’
data:must be a DataFrame exactly the chart data in PowerPoint. - The 1st column in PowerPoint must be the index of the DataFrame. The 2nd in PowerPoint must be a column. See example below.
- Charts’
header-row: turns header row on or off, e.g.header-row: false- If
header-rowis a list, it sets the header row text, e.g.header-row: ['Sales', None, 'Growth <a sub="y">%</a>'].Noneretains the existing header
- If
total-row: turns special formatting for last row on or off, e.g.total-row: truefirst-column: turns special formatting for first column on or off, e.g.first-column: truelast-column: turns special formatting for last column on or off, e.g.last-column: true
Charts’ data: must be a DataFrame exactly the chart data in PowerPoint. For example, a 1-series column chart like this:
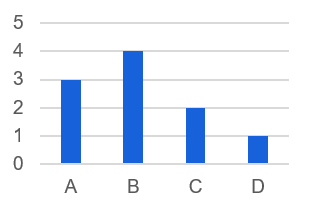
… uses data like this:
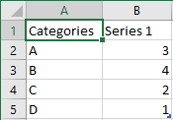
The 1st column must be the index of the DataFrame, and the 2nd must be a column, like this:
data = pd.DataFrame({
  'Categories': ['A', 'B', 'C', 'D'],
  'Series 1': [3, 4, 2, 1]
}).set_index('Categories')
Note: The first column name “Categories” is not used. It’s just a placeholder for the index name.
Run the Chart example
Clone shapes
Use clone-shape: to clone a shape for as many times specified. For example:
rules:
  - Rectangle 1:
      clone-shape: [A, B, C]
      text: f'Clone {clone.key} {clone.val}'
This repeats the shape three times, with text “Clone 0: A”, “Clone 1: B” and “Clone 2: C”.
clone-shape: must be an expression that returns one of these types. When cloning,
the variables (clone.key, clone.val) are set as follows (just like copy-slide:):
- tuple or list, e.g.
[x, y]🡆(0, 'x'), (1, 'y') - dict, e.g.
{x: 1, y: 2}🡆(1, 'x'), (2, 'y') - pandas Series, e.g.
pd.Series(['x', 'y'], index=[3, 4])🡆(3, 'x'), (4, 'y') - pandas DataFrame, e.g.
pd.DataFrame({'x': row1, 'y': row2})🡆('x', row1)), ('y', row2) - pandas GroupBy, e.g.
data.groupby('key')🡆 GroupBy iterator with group name and subsetted data
For each cloned shape, the data variable clone is set. It has these attributes:
clone.pos: 0, 1, 2, … for each cloned shapeclone.key: For lists or tuples, this is the same asclone.pos. For dicts, Series, DataFrames, etc, it’s the key or indexclone.val: Value corresponding toclone.keyclone.parent: If a group was cloned, and a shape inside the group was cloned too,clone.parentreturns thecloneobject of the parent groupclone.shape: Currently cloned PPTX shape, e.g.clone.shape.width
Run the Clone Shape example
Debug
If PPTXHandler fails, a good way to debug is to
print:prints the result of an expression using data, e.g.print: shape.nameprints the current shape name. Print multiple values as a list, e.g.print: [shape.name, clone.key]
Register
Register let you create your own custom commands. It can run any Python code using 3 variables:
shape: the PPTX shape)spec: whatever configuration value you pass to the commanddata: dictionary that has whatever data is available to the command
For example, here are some custom commands:
register:
  rename: setattr(shape, "name", spec) # Add a "rename" command that changes the shape's name
  turn: setattr(shape, "rotation", spec) # Add a "turn:" command that changes the shape's angle
  custom: my_method(shape, spec, data) # my_method can do anything with the shape and val
rules:
  - Shape 1: # Take the shape named Shape 1
      rotate: 45 # Rotate clockwise 45
      rename: New Shape 1 # Change the shape name to New Shape 1
      my_method: ... # Any object can be passed to my_method
Reference
Expressions
PPTXHandler is mostly used to change presentations using data. So values are evaluated as Python expressions. For example:
data:
  widths: [1, 2, 3]
  colors: [red, blue, green]
rules:
  - Rectangle 1:
      # Type in YAML strings almost like you would type it in Python
      width: sum(widths) # Python expression using "widths" as a variable. Returns 1+2+3=6
      fill: colors[0] # Python expression using "colors" as a variable. Returns "red"
      left: 10 # Numbers in YAML are numbers in Python too. This sets left: 10 inches
      stroke: [255, 0, 0] # Lists in YAML are lists in Python too. This sets the stroke to red
What won’t work are literal strings. Instead, use f'...' – a Python format-string. For example:
      # Incorrect
      color: red              # This is NOT 'red'. This is the VARIABLE red (which is not
      color: 'red'            # This is NOT 'red'. This is the VARIABLE red (which is not defined)
      # Correct
      color: f'red'           # Use formatted strings inside.
      text: f'Color {colors[0]}'  # These can be templates. This sets text to 'Color red'
To use literal values, you can also use {value: ...}. For example:
      # Incorrect
      color: 'red'            # This is NOT 'red'. This is the VARIABLE red (which is not defined)
      # Correct
      color: {value: red}     # Strings inside value: are treated literally
      text: {value: 'Color {colors[0]}'}  # These can be templates. This sets text to 'Color red'
To fully switch to literal values instead of expressions, use mode: literal. For example:
mode: literal
rules:
  - color: red # This sets the color to the string "red"
Literals
By default, values passed to pptgen() are used as-is. For example:
widths = [1, 2, 3]
colors = ['red', 'blue', 'green']
pptgen('source.pptx', rules=[
  'Rectangle 1': {
    'width': sum(widths),   # Values are passed as-is. Returns 1+2+3=6
    'fill': colors[0],      # Values are passed as-is. Returns "red"
    'left': 10,             # Numbers are passed as-is. This sets left: 10 inches
    'stroke': [255, 0, 0],  # Lists are passed as-is. This sets the stroke to red
    'color': 'red',         # Strings can be passed as-is
    'text': 'Shape {shape.name}'  # Strings are formatted with data. This sets text to 'Shape Rectangle 1'
  }
])
To use expressions instead of literals, use {expr: ...}. For example:
pptgen('source.pptx', rules=[
  'Rectangle 1': {
    'clone-shape': widths,                # Clone the shape for each entry in "widths"
    'width': {'expr': '1 + clone.val'},   # The value is an expression. Sets width to 1 + width
  }
])
To fully switch to expressions instead of literals, use mode='expr'. For example:
pptgen('source.pptx', mode='expr', rules=yaml_config['rules'])
Data
PPTGen can change presentations with data from various sources. It uses the same syntax as FormHandler. It supports these keys:
url:A SQLAlchemy URL or file nameext:file extension (if url is a file). Defaults to url extensiontable:table name (if url is an SQLAlchemy URL)query:optional SQL query to execute (if url is a database)transform:optional in-memory transform. The loaded data (typically a DataFrame) is in the variabledata. It should return a revised dataset (typically a DataFrame)args:optional filters to apply to dataset, passed as a dict of lists. For example,{'city':['Oslo', 'Kiev']}filters where city is Oslo or Kiev.{'population>~', '100000'}filters where population is 100,000+.- Any additional keys are passed to
gramex.data.filter(), and in turn togramex.cache.open()orsqlalchemy.create_engine().
You can also specify the data as a function using function:. This can be any Python expression or pipeline.
Example:
data:
  cities: { url: cities.csv } # Load cities.csv into "cities" key
  sales: { url: sales.xlsx, sheet: Sheet1 } # Load Sheet1 from sales.xlsx into "sales" key
  tweets: { url: tweets.json } # Load JSON data into "tweets" key
  sample: { url: mysql://server/db, table: sample } # Load sample data from MySQL
  filter:
    url: cities.csv # Load cities.csv
    args: # Filter results
      city: [Oslo, Kiev] # WHERE column "city" is Oslo or Kiev
      population>~: 100000 # AND column population is 100,000+
  custom1:
    function: gramex.cache.open('data.xlsx') # Run a custom function
  custom2:
    function: gramex.cache.open(handler.get_arg('file')) # Functions can accept handler as argument
  big_cities:
    function: cities[cities.population > 100000] # You can also access loaded datasets
These datasets are available in expressions as variables. For example, you can use:
rules:
  - Rectangle 1:
      text: cities.columns[0]
  - Rectangle 2:
      text: tweets[0]['text']
Expressions can also use these pre-defined variables. (DON’T create a variable with these names. They will be over-ridden.)
prs: the source PPTX as a pptx.Presentation object, e.g.len(prs.slides)slide: the current slide being processed, e.g.slide.shapes.titleshape: the current shape being processed, e.g.shape.widthorslide.namehandler: the PPTXHandler instance (if available), e.g.handler.get_arg('title')
They may also use these variables where available:
copy: info on the currently copied slide, e.g.copy.key,copy.valclone: info on the currently cloned shape, e.g.clone.key,clone.valcell: info on the currently processed cell in a table, e.g.cell.val
Length units
Any command that sets a length, e.g. width: 5, uses “inches” by default. You can change the unit
to “cm” using width: 5 cm. Or, you can change the default unit from “inches” to “cm” by passing
unit: inches to the PPTXHandler configuration.
Valid length units are:
inches: inches. Usein,inch, or"as an alias – e.g.3.2"is3.2 inches)cm: centimetersmm: millimeterspt: points are 1/72 inchescentipoints: hundredths of a point, i.e. 1/7200 inch. Usecporcentipointas an aliasemu: English metric units (1/914400 inches)
Color units
Any command that sets a color, e.g. fill: f'red', accepts colors in one of these formats:
- a named color, like
red - a hex value, like
#f80or#ff8800 - an RGB value, like
rgb(255, 255, 0) - a tuple or list of integer RGB values, like
(255, 255, 0)or[255, 255, 0] - a tuple or list of float RGB values, like
(1.0, 0.5, 0.0)or[1.0, 0.5, 0.0] - a theme color, like
ACCENT_1,ACCENT_2,BACKGROUND_1,DARK_1,LIGHT_2 - a theme color with a brightness modifier, like
ACCENT_1+40, which is 40% brighter than Accent 1, orACCENT_2-20which is 20% darker than Accent 2 noneclears the color, i.e. makes it transparent
PPTGen Library
You can access the pptgen library to change presentations programmatically.
PPTXHandler is just a wrapper around pptgen. The keyword arguments for pptgen() are the
same as for PPTXHandler. Here’s an example:
from gramex.pptgen2 import pptgen
target = pptgen(
  source='input.pptx',                # Input file to load
  data={
    'sales': {'url': 'sales.csv'}     # Load sales data from sales.csv
  },
  rules=[                             # Apply these rules
    {
      'slide-number': 1,              # Take only the first slide
      'Title 1': {                    # Find all shapes named "Title 1"
        'text': 'Total sales is {sales["sales"].sum()}'   # Replace text with data template
      }
    }
  ]
)
target.save('slide1.pptx')  # Save the target
The Python library does not treat strings as expressions. So 'red' means the
string “red”, not the variable red. You can specify string values as-is. (If you want to use the
variable red in Python, use data['red']).
But if you need to use expressions (e.g. to specify copy.val in a copy-slide:),
you can use {'expr': '...'}. For example:
from gramex.pptgen2 import pptgen
target = pptgen(
  source='input.pptx',                # Input file to load
  rules=[                             # Apply these rules
    {
      'slide-number': 1,              # Take only the first slide
      'copy-slide': ['A', 'B'],       # Copy it twice
      'Title 1': {                    # Find all shapes named "Title 1"
        'add-top': {'expr': 'copy.key * 10'}, # Add 0 * 10 to slide A's top, 1 * 10 to slide B's top
      }
    }
  ]
)
target.save('slide1.pptx')  # Save the target
PPTX to images
To convert presentations to images, install LibreOffice and ImageMagick. On Linux, the commands are:
apt-get install default-jre
apt-get install libreoffice-core --no-install-recommends
This command converts source.pptx into source.pdf using LibreOffice, and then into
img-01.png, img-02.png, etc (one image per slide) using ImageMagick.
soffice --headless --convert-to pdf source.pptx     # Convert to PDF first for multi-slide export
convert source.pdf -resize 800x600 'img-%03d.png'   # Convert into img-01.png, img-02.png, etc
Support
PPTGen currently cannot handle:
- Equations
- Zoom