Bestselling Pharmaceutical Drugs
Let’s see how we can visualize the Best selling pharmaceuticals of 2017/18 using PPTXHandler.
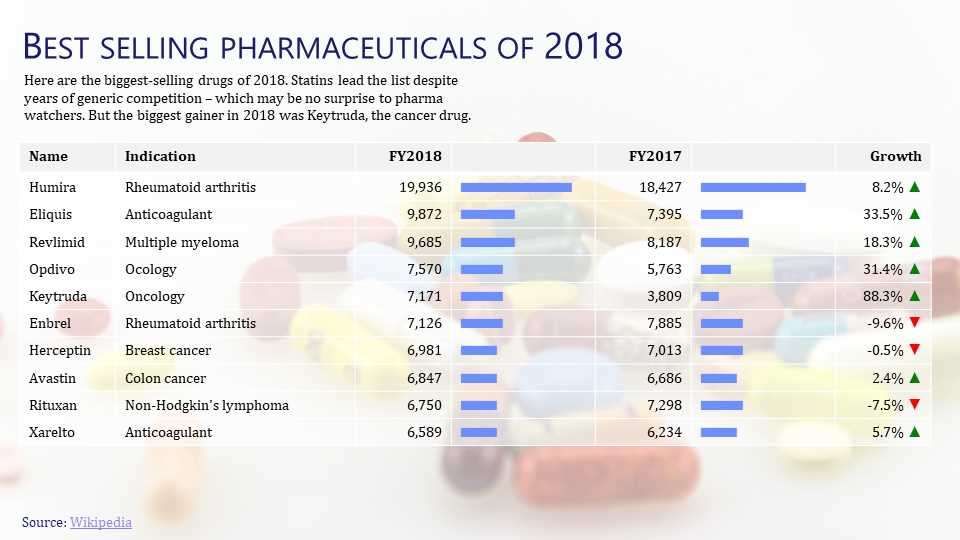
We’re aiming for a result like this:
Here’s a video explaining each step of this tutorial.
Create the source template
Start by creating a template.pptx that has the static content laid out.

All of the content is static, except for the table called Sales Table.
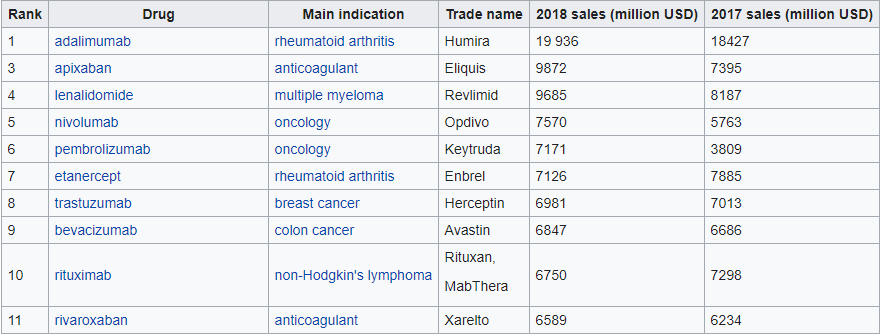
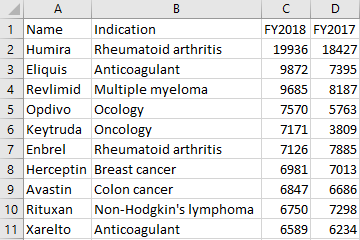
Create the data
The data is available from the Wikipedia. Let’s copy the data into a CSV file sales.csv.
Create the rules
Let’s set up a basic gramex.yaml file that loads the template and the data.
url:
  pptxhandler/table:
    pattern: /$YAMLURL/output.pptx
    handler: PPTXHandler
    kwargs:
      version: 2
      source: $YAMLPATH/template.pptx
      data:
        sales:
          url: $YAMLPATH/sales.csv
The data has fewer columns than we need, so let’s add 3 columns:
Bar 2018: a dummy column to show the bar chart of 2018 salesBar 2017: a dummy column to show the bar chart of 2017 salesGrowth: Yearly growth in 2018
We add these columns with the Pandas transform: key. This needs a single expression, so we
combine the transforms using or.
transform: >
  data.insert(3, 'Bar 2018', data['FY2018']) or
  data.insert(5, 'Bar 2017', data['FY2017']) or
  data.insert(6, 'Growth', data['FY2018'] / data['FY2017'] - 1) or
  data
We now set up the basic formatting for the table, using sales data. This also sets the font size
and vertical alignment for the entire table.
rules:
  - Sales Table:
      table:
        data: sales
        vertical-align: f'middle'
        font-size: f'11 pt'
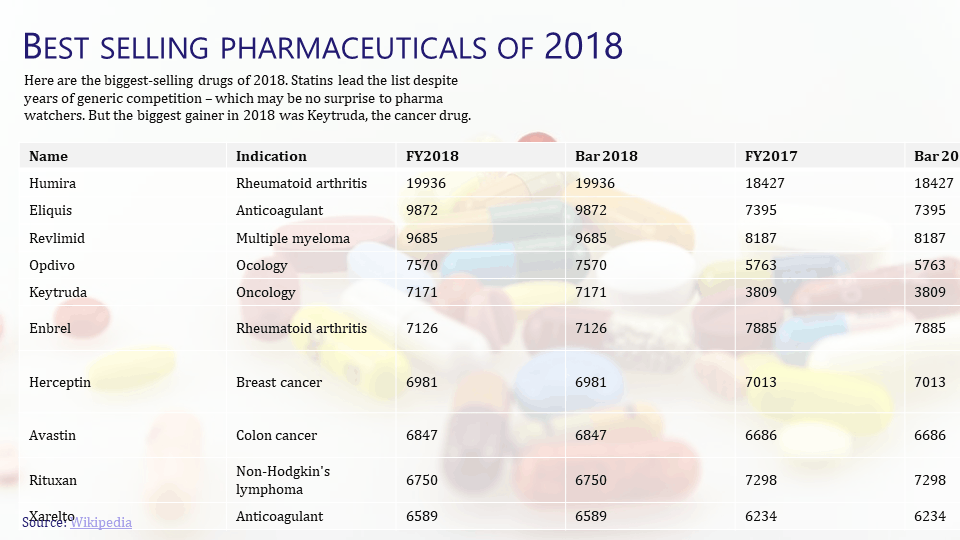
That gives us this result.
Let’s start by adjusting the table headers, and aligning the numeric columns to the right.
header-row:
- Name
- Indication
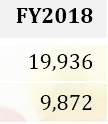
- '<p align="right">FY2018</p>'
- ""
- '<p align="right">FY2017</p>'
- ""
- '<p align="right">Growth</p>'
Now, let’s look at the text. The first two columns are straight-forward.
text:
  Name: cell.val
  Indication: cell.val
For the numbers, we just need to right align them and add a comma separator (e.g. “10,000” instead of “10000”). We use Python string formatting for this.
FY2018: f'<p align="right">{cell.val:,}</p>'
FY2017: f'<p align="right">{cell.val:,}</p>'
For the bars, we repeat the same “█” character multiple times, using
- a blue shade (
accent_1from the theme) - Arial font
- 6 pt (determined through trial and error)
For every $1,000 million (or a billion) of sales, we show one “█”.
Bar 2018: f'<a color="accent_1" font-name="Arial" font-size="6pt">' + ('█' * int(cell.val / 1000)) + '</a>'
Bar 2017: f'<a color="accent_1" font-name="Arial" font-size="6pt">' + ('█' * int(cell.val / 1000)) + '</a>'

We’ve manually added spaces between character to give you an idea of character width.
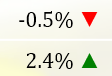
Finally, the Growth column has a red ▼ or a green ▲ depending on whether growth was positive or negative.
Growth: f'<p align="right">{cell.val:.1%} ' +
  ('<a color="red">▼</a>' if cell.val < 0 else '<a color="green">▲</a>') +
  '</p>'
Finally, let’s adjust the width of these columns (determined by trial and error).
width:
  Name: 1
  Indication: 2.5
  FY2018: 1
  Bar 2018: 1.5
  FY2017: 1
  Bar 2017: 1.5
  Growth: 1
This is the final configuration
See the result