Visualizing Subsurface Float Movement with InfluxDB & FormHandler
This tutorial shows how to use InfluxDB via FormHandler. Specifically, we will store a dataset of the GPS coordinates of a set of subsurface floats in InfluxDB, and visualize them on a map with Leaflet.
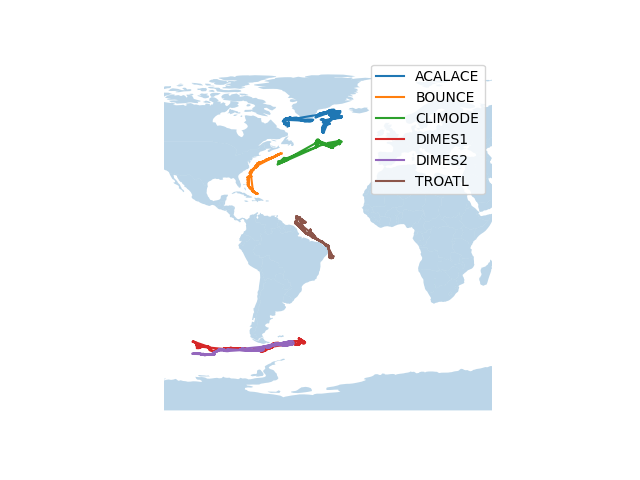
The dataset contains floats belonging to six experiments. Over the course of the experiment, the floats travelled along the Americas as shown above. In this tutorial, we will build an app that visualizes the journey of these floats in real-time.
Step 0: Prerequisites
To follow through this tutorial completely, you will need:
- Gramex community edition (see installation instructions)
- An InfluxDB server
- The InfluxDB Python client
We recommend running InfluxDB via Docker, as follows:
docker pull influxdb:latest
docker run -d -p 8086:8086 \
  -e DOCKER_INFLUXDB_INIT_MODE=setup \
  -e DOCKER_INFLUXDB_INIT_USERNAME=user \
  -e DOCKER_INFLUXDB_INIT_PASSWORD=password \
  -e DOCKER_INFLUXDB_INIT_ORG=org \
  -e DOCKER_INFLUXDB_INIT_BUCKET=sofar \
  -e DOCKER_INFLUXDB_INIT_ADMIN_TOKEN=mytoken123 \
  influxdb:latest
Install the InfluxDB Python client as follows:
pip install 'influxdb-client[ciso]'
Step 1: Getting the data
Download the dataset here, and put it in an empty folder.
The dataset tracks the movement of SOFAR (SOund Fixing and Ranging) floats. These are acoustically tracked submersible devices left in the ocean, and their movements are tracked over a period of time to study oceanic currents.
The data looks like this:
| lat | long | exp | day |
|---|---|---|---|
| 46.521 | -33.005 | CLIMODE | 22 |
| 49.419 | -39.945 | CLIMODE | 21 |
| -58.568 | -91.521 | DIMES2 | 31 |
| 47.157 | -33.939 | CLIMODE | 23 |
| 59.501 | -47.510 | ACALACE | 19 |
Each row represents the latitude and longitude of a float corresponding to an experiment on a single day. Originally, the time period covered by this dataset is nearly a decade, but since we need to finish running the visualization in a much shorter time (say, 30 seconds), we have preprocessed the data such that it appears as if the entire lifetime of the floats is a little over 30 seconds.
Step 2: Setting Up FormHandler for InfluxDB
Step 2.1: The Gramex App Specification
Once the InfluxDB is set up with an initial bucket, create a file named gramex.yaml in the same folder with the following contents:
app:
  browser: true

schedule:
  push-data:
    function: main.push
    startup: true
    thread: true

url:
  influxdbhandler-data:
    pattern: /$YAMLURL/data
    handler: FormHandler
    kwargs:
      url: influxdb:http://localhost:8086/
      username: user
      token: mytoken123
      org: org
      bucket: sofar
      xsrf_cookies: false
      id: _time
Step 2.2: Push Data to InfluxDB
Next, create a file named main.py in the folder, and add the following
content:
import time
import pandas as pd
import requests


def push():
    df = pd.read_json("floats.json")
    while True:
        for day, group in df.groupby("day"):
            requests.post(
                "http://localhost:9988/data?measurement=latlong&tags=exp",
                data=group.to_dict(orient="list"),
            )
            time.sleep(1)
Step 2.3: Add a Map
Next, create a file named index.html in the folder, with the following
content:
<!doctype html>
<html>
<head>
<meta charset="utf-8" />
<link
rel="stylesheet"
href="https://unpkg.com/leaflet@1.7.1/dist/leaflet.css"
integrity="sha512-xodZBNTC5n17Xt2atTPuE1HxjVMSvLVW9ocqUKLsCC5CXdbqCmblAshOMAS6/keqq/sMZMZ19scR4PsZChSR7A=="
crossorigin=""
/>
<style>
html,
body {
height: 100%;
width: 100%;
}
body {
margin: 0;
}
#map {
width: 100%;
height: 100%;
}
</style>
</head>
<body>
<div id="map"></div>
</body>
<script src="https://d3js.org/d3.v3.min.js" type="text/javascript"></script>
<script
src="https://unpkg.com/leaflet@1.7.1/dist/leaflet.js"
integrity="sha512-XQoYMqMTK8LvdxXYG3nZ448hOEQiglfqkJs1NOQV44cWnUrBc8PkAOcXy20w0vlaXaVUearIOBhiXZ5V3ynxwA=="
crossorigin=""
></script>
<script src="https://cdnjs.cloudflare.com/ajax/libs/jquery/3.6.0/jquery.min.js"></script>
<script src="https://cdn.jsdelivr.net/npm/lodash@4.17.21/lodash.min.js"></script>
<script>
var map = L.map("map");
L.tileLayer("https://{s}.tile.openstreetmap.org/{z}/{x}/{y}.png", {
attribution:
'© <a href="https://openstreetmap.org/copyright">OpenStreetMap contributors</a>',
}).addTo(map);
map.fitBounds([
[67, 147],
[-63, -189],
]);
var data = null;
var polyLines = {};
var colors = {};
const updatePath = function (name, latlongs, colors) {
let lat = _.filter(latlongs, { _field: "lat" })[0]._value;
let lon = _.filter(latlongs, { _field: "long" })[0]._value;
if (name in polyLines) {
polyLines[name].addLatLng([lat, lon]);
} else {
polyLines[name] = L.polyline([[lat, lon]], { color: colors[name] });
polyLines[name].addTo(map);
}
};
// More JS goes here.
</script>
</html>
Note that we have:
- added some empty variables to accommodate data later,
- added a function that renders the path of a float on the map, and
- left a placeholder comment to accommodate more Javascript code as we develop the application through the following steps.
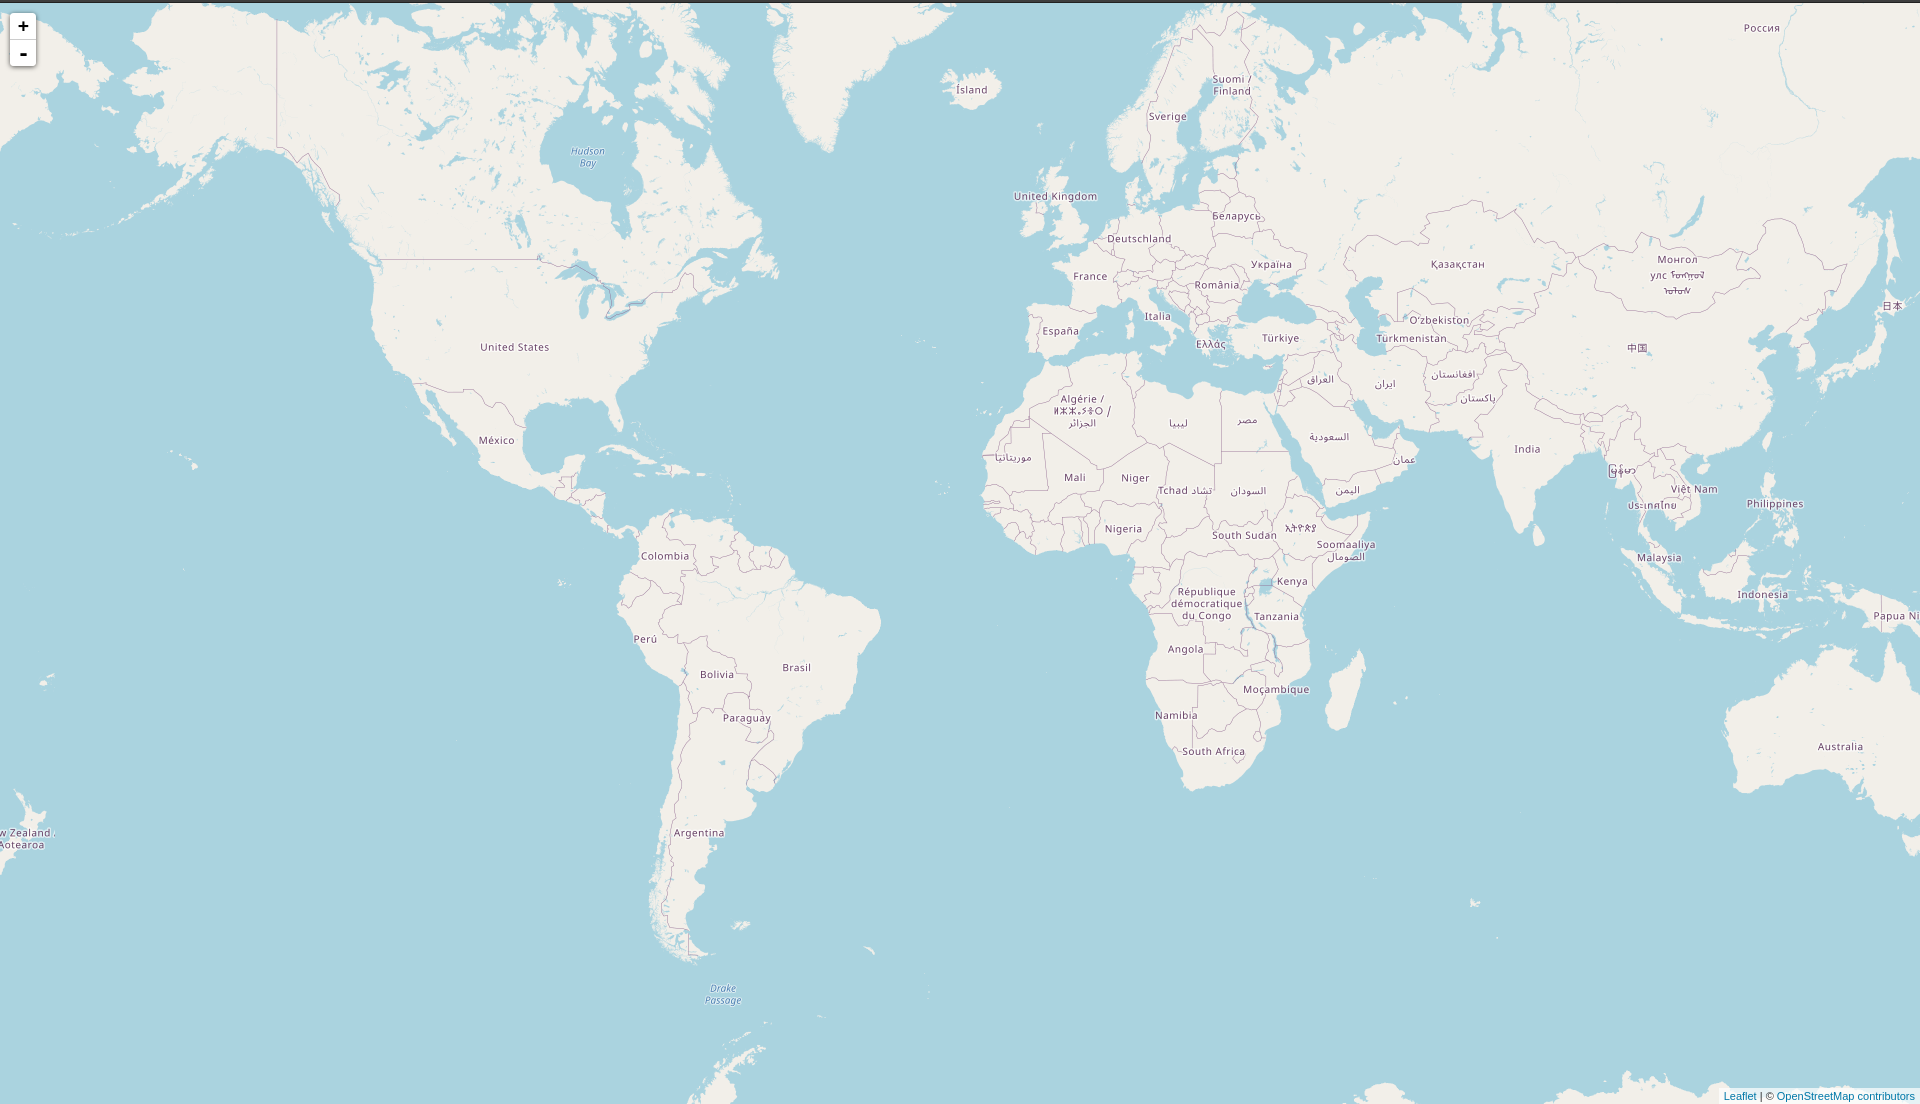
Run Gramex in this folder, and a browser window should open with a map:
If you visit the /data endpoint in the browser,
you should see some data coming into InfluxDB as follows:
[
  {
    _start: 1632727879731,
    _stop: 1635319879731,
    _time: 1635319879185,
    _value: 15.0,
    _field: "day",
    _measurement: "latlong",
    exp: "ACALACE",
  },
  {
    _start: 1632727879731,
    _stop: 1635319879731,
    _time: 1635319873012,
    _value: 9.0,
    _field: "day",
    _measurement: "latlong",
    exp: "BOUNCE",
  }, // etc
];
As you refresh the page a few more times, you should see more and more records.
Step 3: Plotting the Data on the Map
In step 2.2, we created a mechanism that pushes data to InfluxDB every second. Therefore, we also need a corresponding javascript function that pulls the data from InfluxDB every second, and plots it on the map.
To do this, add the following code at the end of the <script> tag in
index.html (note that we had left a comment there earlier, to indicate the
position for the following code.
var colors = _.zipObject(
  ["TROATL", "BOUNCE", "ACALACE", "CLIMODE", "DIMES1", "DIMES2"],
  ["red", "green", "blue", "yellow", "black", "magenta"],
);
var puller = setInterval(function () {
  // Get data accumulated in the last one second
  $.getJSON("data?_offset=-1s").done(function (d) {
    let latest = _.groupBy(
      _.filter(d, (i) => ["lat", "long"].includes(i._field)),
      "exp",
    );
    for (const [expname, latlongs] of Object.entries(latest)) {
      updatePath(expname, latlongs, colors);
    }
  });
}, 1000); // Run this every second
Refresh the page, and you should see a visualization that looks like this: