Albus Dumbledore's Screen Time
Who do you think has the most screen time among the Harry Potter movies?
Let’s ignore Harry, Hermione and Ron. Who’s next? Dumbledore? Voldemort? Someone else? Explore the video below for the answer.
This is a bar chart race. This tutorial explains how to create it.
Here’s a video explaining each step of this tutorial.
Create the data
Let’s start with the data. The original dataset has every Harry Potter character’s Screen Time. We can take a simpler dataset that has the top 5 characters (by screen time) in each movie.
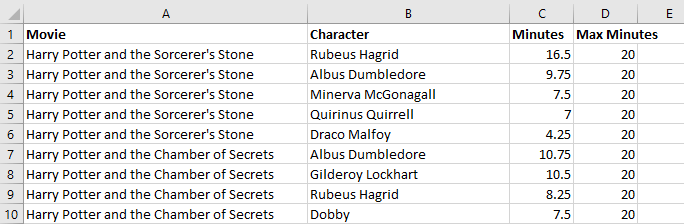
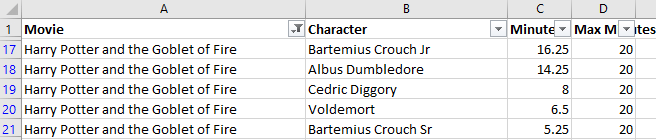
Each row has the screen time for a character in a movie – ignoring Harry, Hermione and Ron.
Movieis the name of the movie (e.g. Harry Potter and the Sorcerer’s Stone)Characteris the name of the character (e.g. Rubeus Hagrid)Minutesis the number of minutes they appear on screen in the movieMax Minutes– well, let’s get into that later
Create the source template
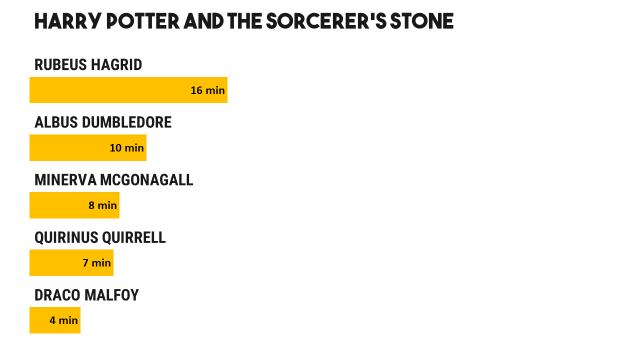
We’ll create a template where each slide has 1 movie, and we’ll show the characters as a bar chart, like this:
Start by creating a template.pptx like this:
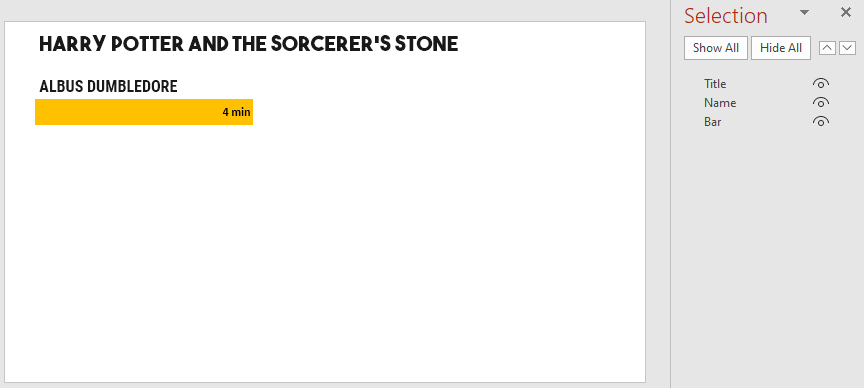
The relevant shapes are:
Title: The slide title (movie name)Name: Name of the characterBar: Character’s Screen time
Create the rules
Let’s set up a basic gramex.yaml file that loads the template and the data.
url:
  pptxhandler/albus-dumbledore:
    pattern: /$YAMLURL/output.pptx
    handler: PPTXHandler
    kwargs:
      version: 2
      source: template.pptx
      data:
        url: screen-time.xlsx
At this point (and any other time), you can run slidesense on the command line to see the output PPTX. Right now the output is exactly the same as template.pptx.
Next, we create a rule to copy one slide for each movie using copy-slide. It loops through each row in the dataset data
rules:
  - copy-slide: data.groupby('Movie', sort=False)
    transition:
      type: f'morph'
      duration: 1
data.groupby('Movie', sort=False) groups
by movie. This ensures that we have one slide per movie (without sorting alphabetically).
We also apply a 1-second morph transition for the bars to animate smoothly into each other.
Next, we set the title of the slide to be the movie name.
Title:
  text: "copy.key"
copy.key has the index of data. Since we grouped by movie, copy.key is the same as the movie.
Now, the output will have one slide for each of the movies. The slide title is updated.
Next, copy each character name – once for each character.
Name:
  clone-shape: copy.val
  add-top: 1.2 * clone.pos
  name: f"!!{clone.val['Character']} name"
  text: clone.val['Character']
Here, copy.val has one row for each movie. This is what it looks like:
clone-shape: copy.valclones the shapeNameonce for each row, i.e. for each character.add-top: 1.2 * clone.posmoves each shape down 1.2 inches times the row position (0, 1, 2, …)text: clone.val['Character']sets the text of the shape to the “Character” column- Shape names begin with
!!so that PowerPoint’s Morph transition will match the shape across slides.name: f"!!{clone.val['Character']} name"ensures that names will move up/down correctly across slides
Next, we set the widths of the bars.
Bar:
  clone-shape: copy.val
  add-top: 1.2 * clone.pos
  name: f"!!{clone.val['Character']} bar"
  width: 5 * clone.val['Minutes'] / clone.val['Max Minutes']
  text: f"{clone.val['Minutes']:.0f} min"
  fill: "'ACCENT_2' if clone.val['Character'] == 'Albus Dumbledore' else 'ACCENT_4'"
clone-shape: copy.valclones the shapeBaronce for each row, i.e. for each character.add-top: 1.2 * clone.posmoves each shape down 1.2 inches times the row position (0, 1, 2, …)name: f"!!{clone.val['Character']} bar"ensures that bars will move up/down correctly across slides along with the character
These three are practically identical to what we did with the name.
width: 5 * clone.val['Minutes'] / clone.val['Max Minutes']sets the width of the bar. We limit this to 5 inches. The “Max Minutes” column is set to 20, indicating that 20 minutes = 5”. But we also have a total minutes slide at the end. There, we use 80 minutes = 5”.text: f"{clone.val['Minutes']:.0f} min"sets the bar’s text to the character’s screen time.fill: "'ACCENT_2' if clone.val['Character'] == 'Albus Dumbledore' else 'ACCENT_4'"fills the bar red (Accent 2) for Albus Dumbledore, but orange (Accent 4) for others. This highlights Albus Dumbledore across slides.
This is the final configuration
See the result
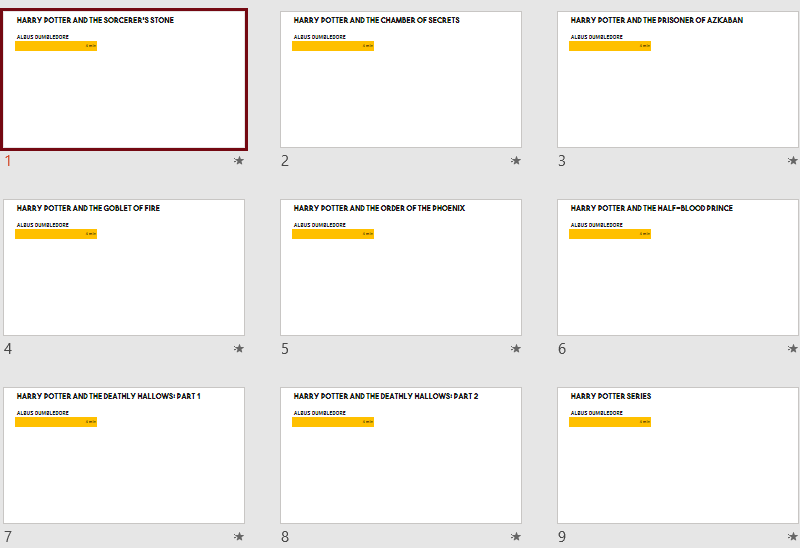
This creates these 9 slides, with transitions:
These slides were exactly the ones used to create this video: