Chart example
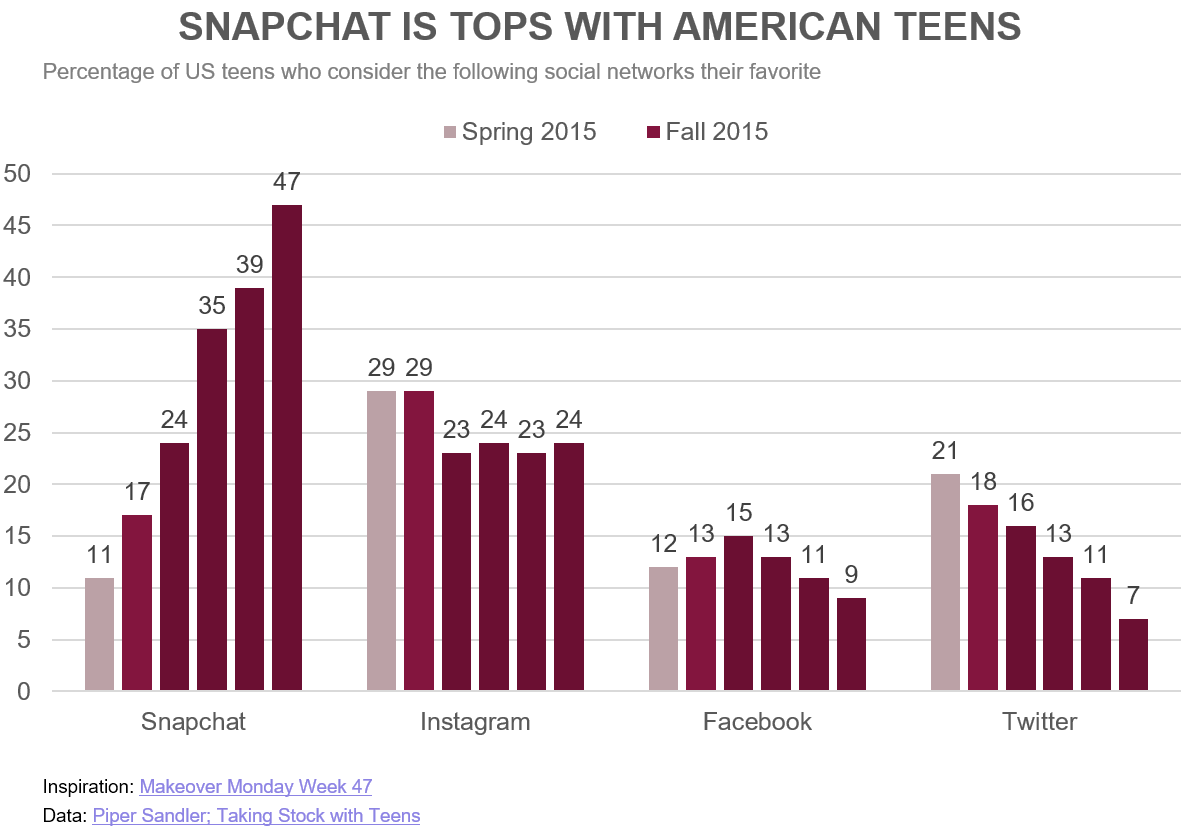
Let’s create this visual “Snapchat is tops with American Teens” (created on Tableau) using PPTXHandler.
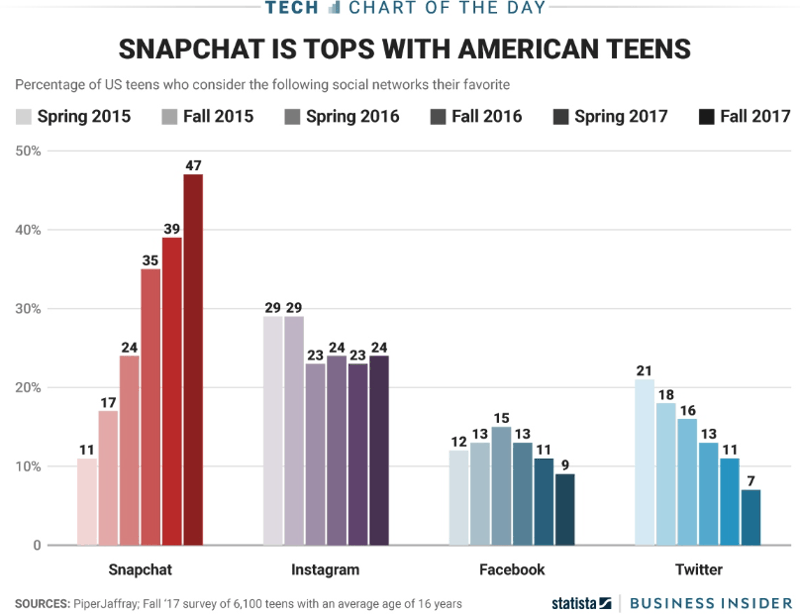
It shows the percentage of US teens who consider the following social networks their favorite:
- Snapchat
Data is from Piper Sandler’s Taking Stock With Teens.
Create the source template
Start by creating a template.pptx that has the static content laid out.
It has only 1 chart shape updated from data, called Column Chart.
Create the data
The data is available from the Piper Sandler. To simplify things, we typed it into a simple structure: social-media-platform.csv.
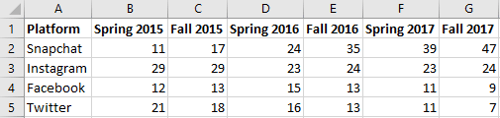
The rows form the categories. The columns form the series.
The first column is the category names. The first row has the series names.
Create the rules
Let’s set up a basic gramex.yaml file that loads the template and the data.
url:
  pptxhandler/chart:
    pattern: /$YAMLURL/output.pptx
    handler: PPTXHandler
    kwargs:
      version: 2
      source: $YAMLPATH/template.pptx
      data: { url: $YAMLPATH/social-media-platform.csv }
Now, let’s update the Column Chart with the data:
rules:
  - Column Chart:
      chart-data: data.set_index('Platform')
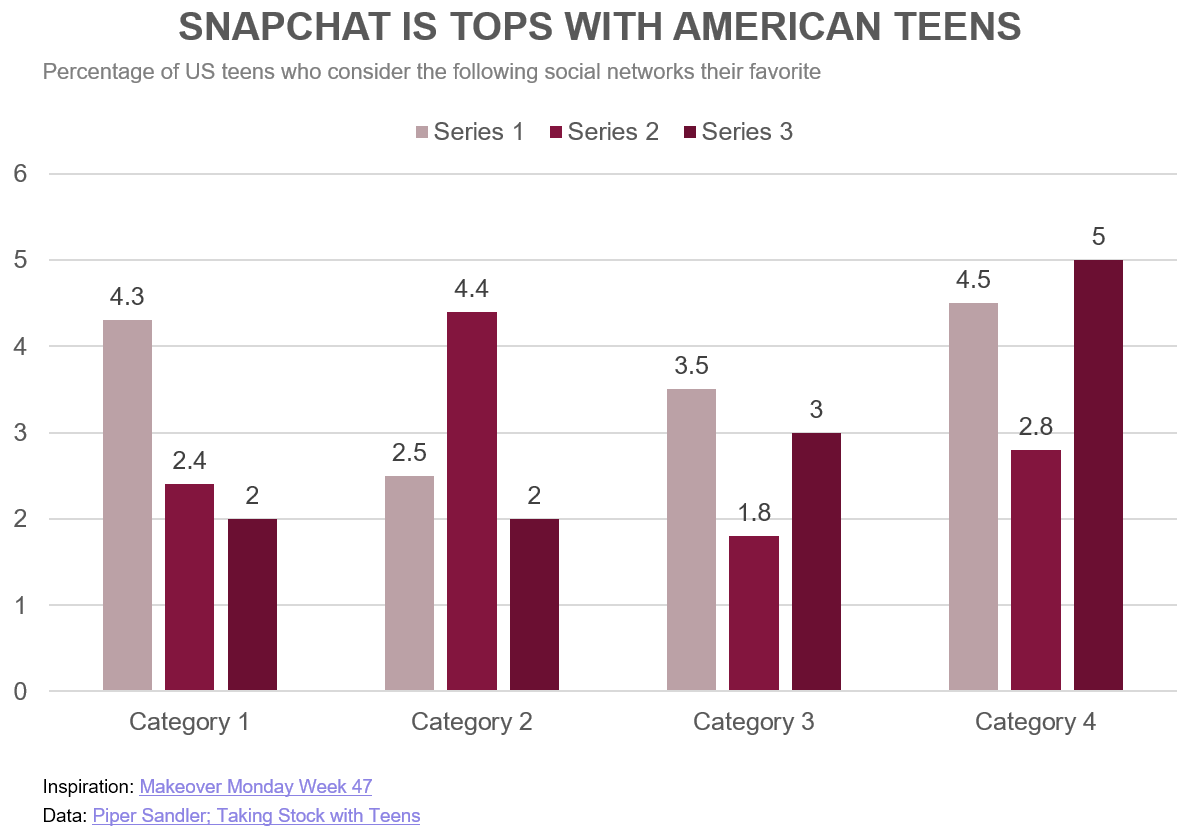
PowerPoint charts need eac category to have the same color. To re-create the colors in the original, we need 4 charts. But we will skip that for this tutorial (and leave that as an exercise for you.)
This is the final configuration
See the result