Rate of New Entrepreneurs
Let’s see how we can create this visual on the “Rate of New Entrepreneurs” using PPTXHandler.
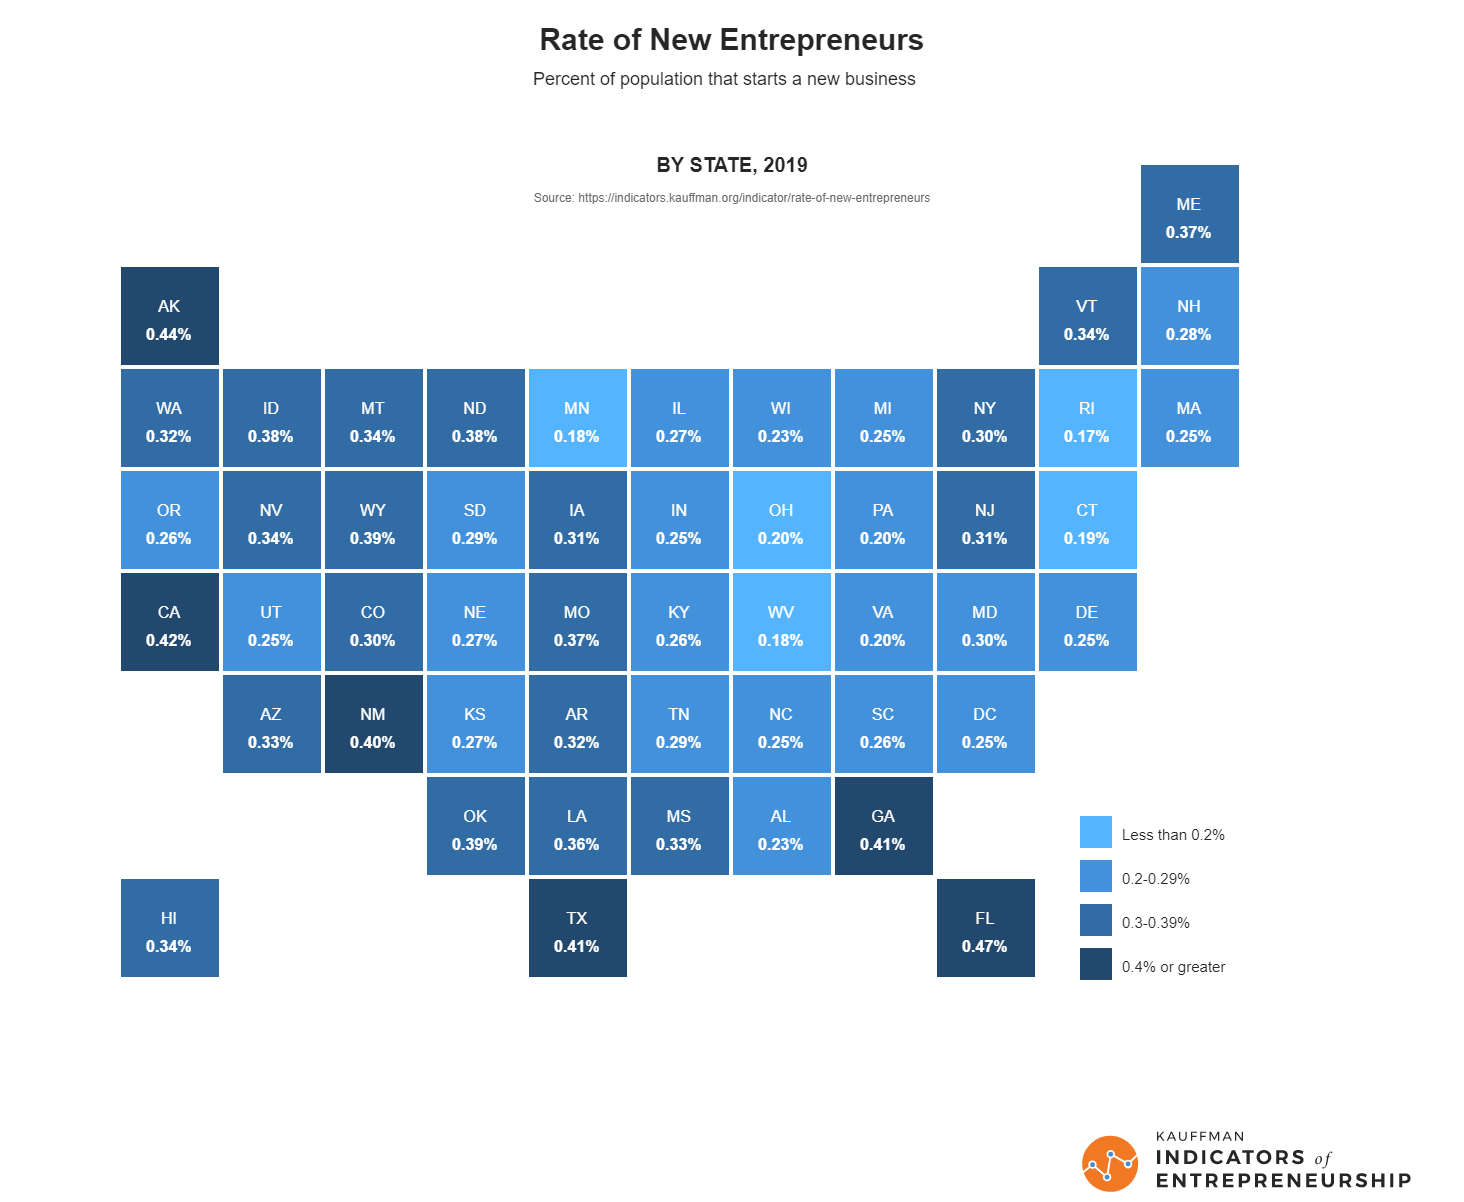
The Kauffman Indicators of Entrepreneurship show entrepreneurial trends in the US. Their entry in the Information is Beautiful awards shows the percentage of population that starts a new business.
Here’s a video explaining each step of this tutorial.
Create the source template
Start by creating a template.pptx that has all the 50 U.S. states + DC laid out.
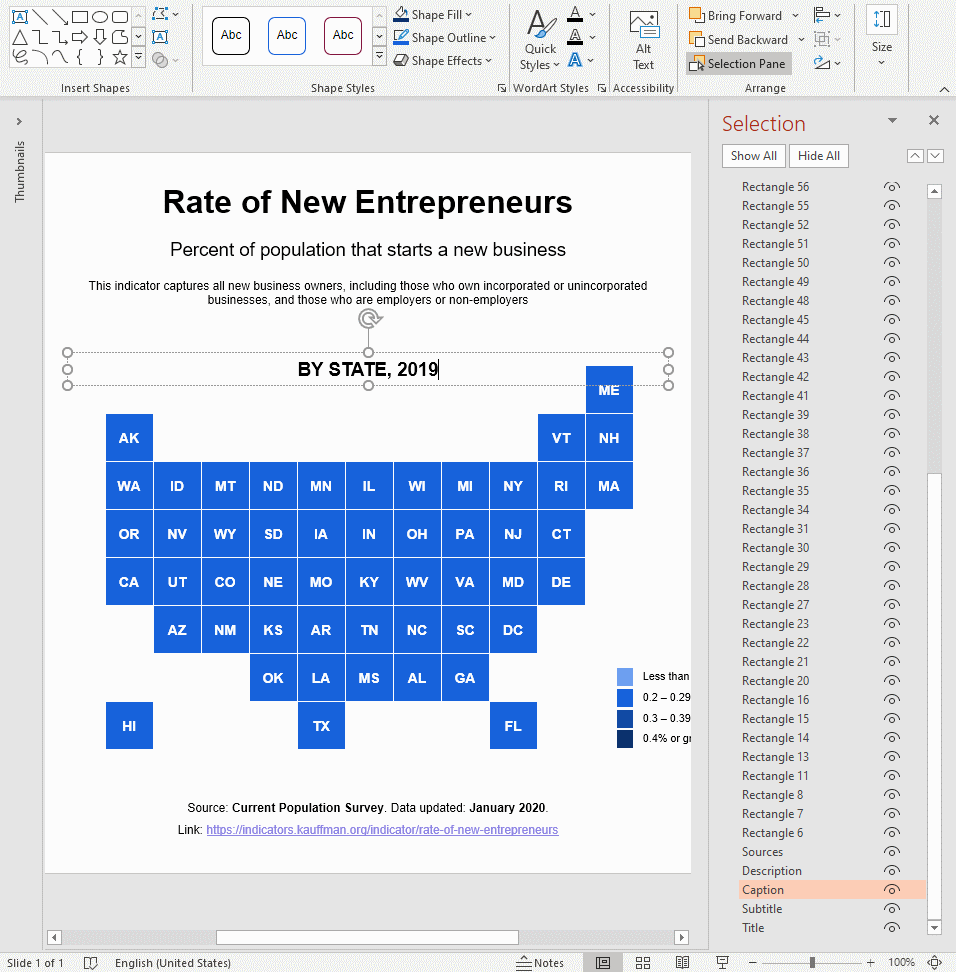
It has 51 rectangles named “Rectangle 6”, “Rectangle 7”, … “Rectangle 56”. The exact names and numbers don’t matter. We will identify them by the 2-letter codes in the text.
It also has text boxes for the title, sources, etc. Since we will create one slide for each year, we’ll also change “Caption” ever slide, which reads “BY STATE, 2019”.
Create the data
The data is available from the Kauffman Indicators Data Downloads page. Let’s save this as data.csv.
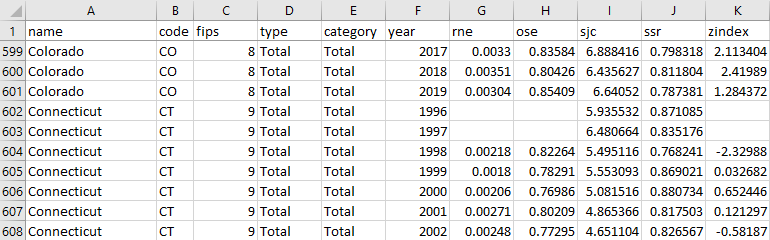
The relevant columns are:
code: The state codeyear: Yearrne: Rate of new entrepreneurs
Create the rules
Let’s set up a basic gramex.yaml file that loads the template and the data.
url:
  pptxhandler/entrepreneurship:
    pattern: /$YAMLURL/output.pptx
    handler: PPTXHandler
    kwargs:
      version: 2
      source: $YAMLPATH/template.pptx
      data: { url: $YAMLPATH/data.csv }
Now, we’ll set up a rule that copies the slide for each year.
rules:
  - copy-slide: data.groupby('year')
    data:
      rne: copy.val.groupby('code')['rne'].first().fillna(0)
This copies the slide for each year. The variable copy.key holds the year. copy.val has the data for the year.
To conveniently access the rne column, we created a dataset called rne. It picks the first (and
only) rne field for each state code that year. So, rne["CA"] has the RNE for California.
Next, let’s change the color of each Rectangle * shape. This matches all shape names starting
with Rectangle.
"Rectangle *":
  fill: >
    "ACCENT_1+40%" if rne[shape.text] < 0.002 else
    "ACCENT_1" if rne[shape.text] < 0.003 else
    "ACCENT_1-25%" if rne[shape.text] < 0.004 else
    "ACCENT_1-50%"
The fill color is set in line with the legend we created on template.pptx.
Next, let’s change the text of each Rectangle * shape.
text: f'<p>{shape.text}</p><p><a bold="n" font-size="8 pt">{rne[shape.text]:.2%}</a></p>'
<p>{shape.text}</p>creates the first line with the state name. (The source rectangles are bold. So is this.)<p><a bold="n" font-size="8 pt">{rne[shape.text]:.2%}</a></p>creates the second line with the RNE value as a percentage. It’s 8 pt (a bit smaller) and not bold.
This creates a result like this for each state:

Finally, change the caption every slide. {copy.key} is the year.
Caption:
  text: f'BY STATE, {copy.key}'
This is the final configuration
See the result
