US Election Results Map
Let’s create a map of the US Presential Election results by state using PPTXHandler.

This colors the US states by the party that won in the state (Democrat - Blue, Republican - Red). Darker colors represent a higher margin of victory. Data is from MIT’s Election Lab.
Create the source template
Start by creating a template.pptx that has the static content laid out.

It has 3 types of shapes that will be updated from data:
AL,AK,AR,AZ…: one rectangle for each stateYear: the title that’ll show the yearDem-0,Rep-0,Dem-10,Rep-10, …: color scales for different margins of victory
Create the data
The data is from MIT’s Election Lab. To simplify things, we aggregated it by year and state into us-president-election-margin.csv.
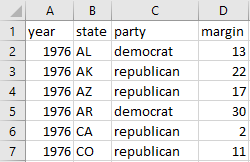
year: the election yearstate: 2-letter US state abbreviationparty: party that won the state Presidential electionmargin: margin of victory as a %
Create the rules
Let’s set up a basic gramex.yaml file that loads the template and the data.
url:
  pptxhandler/choropleth:
    pattern: /$YAMLURL/output.pptx
    handler: PPTXHandler
    kwargs:
      version: 2
      source: $YAMLPATH/template.pptx
      data:
        margin:
          url: $YAMLPATH/us-president-election-margin.csv
Now, we’ll set up a rule that copies the slide for each year.
rules:
  - copy-slide: data.groupby('year')
This copies the slide for each year. The variable copy.key holds the year. copy.val has the data for the year.
Next, let’s set the year on each slide:
"Year":
  text: copy.key
Now, we’ll create a new dataset called margins. This has the data for each year, indexed by state.
data:
  margins: copy.val.set_index('state')
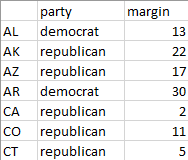
margins looks like this. For example, margins['AL'] has the data for Alabama.
We’ll color each state shape with a color scale for the party. Add this under data:
color: >
  {
    'democrat': gramex.scale.color(domain=[-20, 50], range='Blues'),
    'republican': gramex.scale.color(domain=[-20, 50], range='Reds'),
    'democratic-farmer-labor': gramex.scale.color(domain=[-20, 50], range='Purples'),
  }
Now colors['democrat'](5) returns the color for a 5% democrat margin (a light blue color.)
gramex.scale.colorcreates a color scaledomain=[-20, 50]sets the lightest color for -20 and the darkest for 50. (We chose -20 instead of 0 because that makes 0 look slightly brighter, instead of a faded white)range='Blues'uses the “Blues” color map. See the list of color maps
We’ll use this to color each state based on the winning party and margin.
"??":
  fill: color[margins['party'][shape.name]](c)
??selects all shapes with 2 letters (e.g.AL,AK,AR,AZ)margins['party'][shape.name]has the winning party for each state code (shape.name)margins['party'][shape.name]has the winning party’s margin for each state code (shape.name)- These are used to effectively create
fill: color[party](margin)
Next, we’ll add the margin to the text
text: f'<p><a font-size="11 pt">{shape.name}</a></p><p><a font-size="8 pt">{margins["margin"][shape.name]}%</a></p>'
<p><a font-size="11 pt">{shape.name}</a></p>is the first line. It shows the state code in 11 pt<p><a font-size="8 pt">{margins["margin"][shape.name]}%</a></p>is the second line. It shows the margin% in 8 pt
Finally, we’ll set the color scales:
Dem-0: { fill: 'color["democrat"](0)' }
Rep-0: { fill: 'color["republican"](0)' }
Dem-10: { fill: 'color["democrat"](10)' }
Rep-10: { fill: 'color["republican"](10)' }
Dem-20: { fill: 'color["democrat"](20)' }
Rep-20: { fill: 'color["republican"](20)' }
Dem-50: { fill: 'color["democrat"](50)' }
Rep-50: { fill: 'color["republican"](50)' }
This is the final configuration
See the result