Hype up your Power BI dashboards with Gramex Plugins

Elevate Business Reporting with Power BI custom visuals

85% of companies cannot keep track of the dashboards they generate

But even with a slew of dashboards and data,
the insights are still unclear

  • What Questions do the dashboards answer?
  • Are the Answers evident on the dashboard?
  • What are the next Actions to take?

Level Up with our 3
Power BI Offerings

Custom Power BI dashboards that will narrate insights as data stories, be it:

  • Business Dashboards
  • Visual stories
  • Dynamic KPI platforms
  • Design enhancements
  • Cloud

Develop beautiful Power BI custom visuals as plugins in Power BI

  • Automated Insights
  • Comicgen – comic generator
  • Geo Maps
  • Embed Analytics through R & Python
  • Choropleth plug in
  • Cartogram plug in

Our Power BI experts will teach you how to create dashboards that narrate insights as data stories

  • Layout planning for Power BI
  • Design & components
  • Dashboard in a Day
  • Best practices
  • Leveraging AI in Power BI

How Can You Extend your BI Tool Capabilities to the Next Level of Productivity?

How Can You Extend your BI Tool Capabilities to the Next Level of Productivity-01

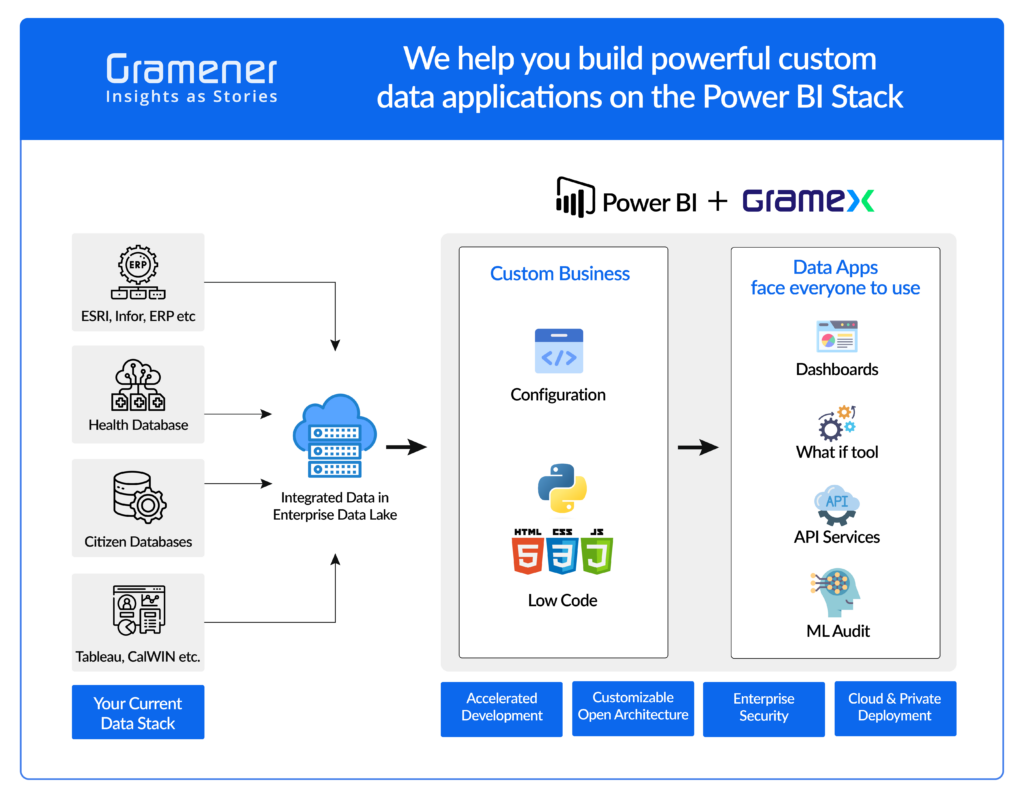
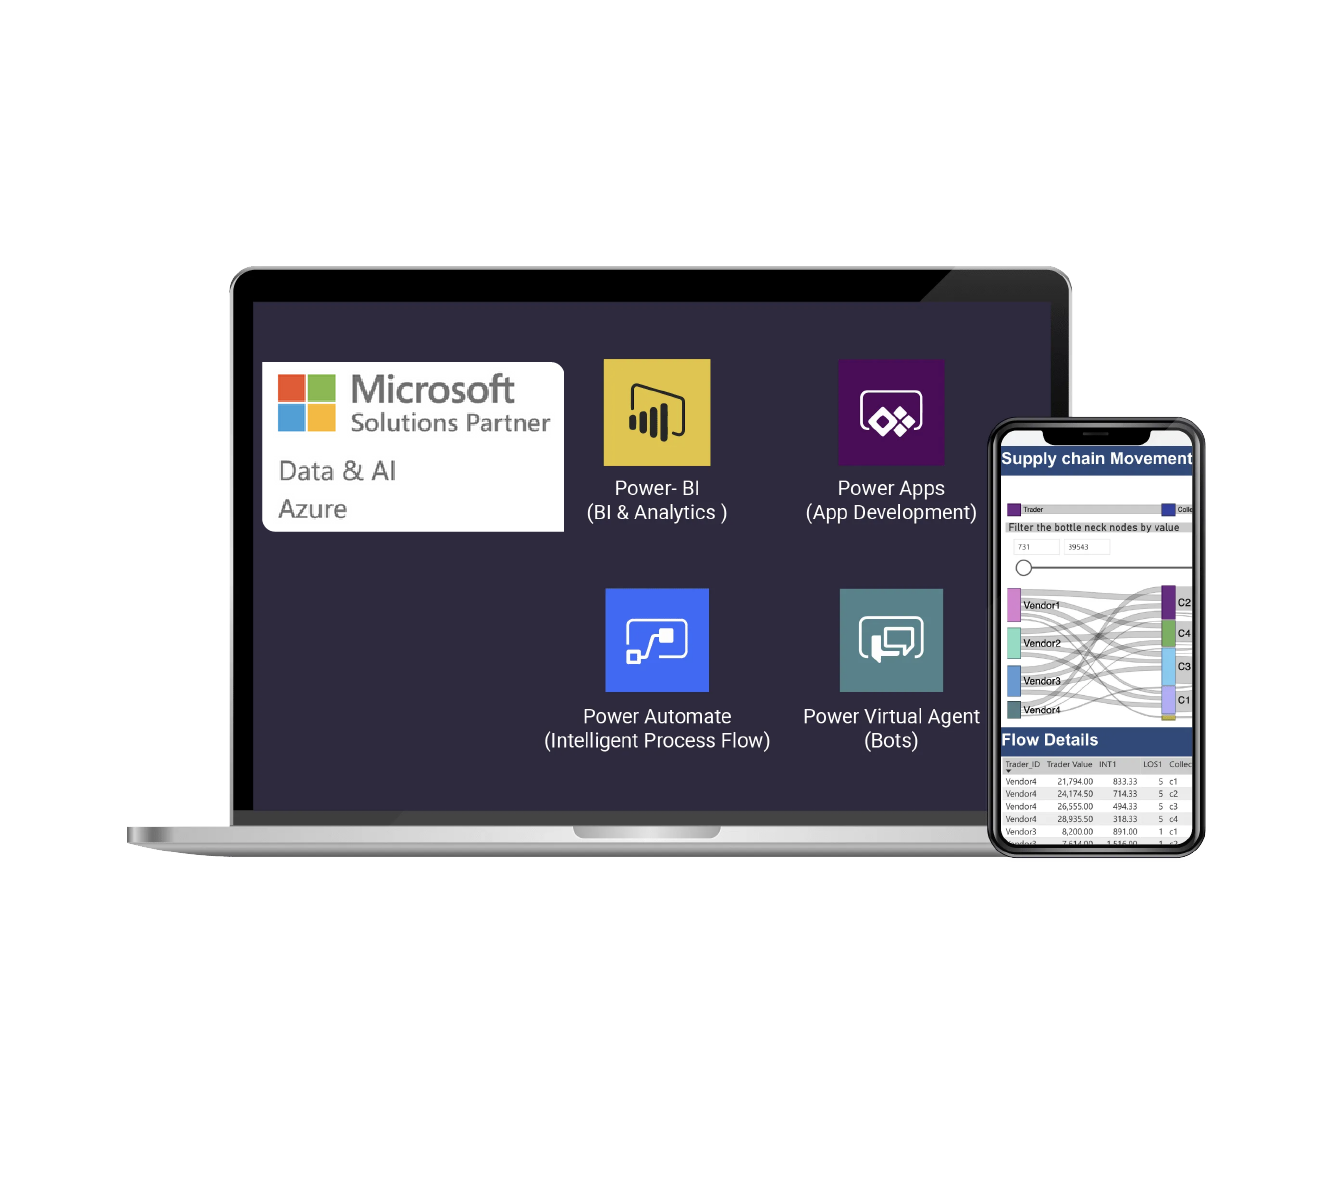
Leverage BI Components

Leading with Information Design, develop insights assets using BI components

How Can You Extend your BI Tool Capabilities to the Next Level of Productivity-02

Integrate Custom components

Integrate custom & re-usable charting and data story components within your BI Reports by using Javascript components or plug-ins

How Can You Extend your BI Tool Capabilities to the Next Level of Productivity-03

Co-existing assets in Digital Applications
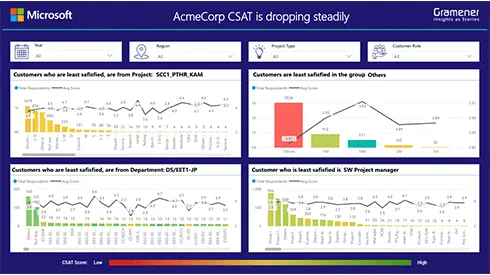
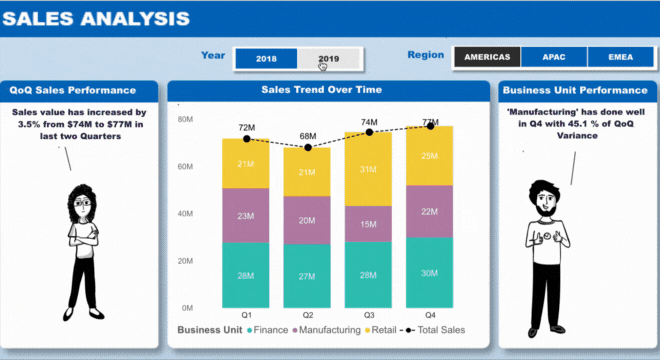
Deploy co-existing custom and Tableau components on your digital applications such as websites, portals or mobile apps

Talk to our Power BI consultants

On how to leverage a common data pipeline while scaling up your self-service BI to the next level of storytelling.

On Power BI: From Data to Stories in 3 Steps

img
Icons-01

Building Hypothesis

Define the problem that needs to be answered. Build multiple hypothesis based on problem statement and finalize for further analysis. Highlight interesting data insights on the problem area

img
Icons-02

Deep Down Analysis

Deep dive into the problem based on initial analysis. Highlight data insight which explores the initial hypothesis. Highlight mutually exclusive & exhaustive data insights based on the problem

Icons-03

Actionability

Understand the conclusion that can be made from the analysis. Derive some actionability from the solution. Explore the actions that need to be taken to address the problem area

Data Storytelling with Power BI Dashboards

Sales dashboard in Power BI

Analyze quarter-over-quarter performance of your sales in various global regions. Pull all the sales data in Power BI dashboard and rapidly Identify trends over time and business unit performance.

Covid-19 dashboard in Power BI

Mine high-quality insights from COVID-19 data. Build interactive storytelling dashboards in Power BI with our integrated plugins to narrate insights from various states and regions.

Life expectancy analysis in Power BI

People from which country live longer? This is an analysis on Power BI about the life expectancy of people from Europe, Asia, America and Africa against income per person.

Sales opportunities analysis in Power BI

How to maximize the revenue with detailed view of sector wise sales? This Power BI data app identifies opportunities in the pipeline to improve the deal margins by upselling the services.

Supply chain analysis in Power BI

This data app helps to reduce lead time and inventory by identifying the bottlenecks along various strands of Supply Chain where shipments are significantly delayed.

Customer journey stories on Power BI

What drives your customers’ satisfaction? Visualize customer journey and identify insights that help you improve CX across geographies, projects, customer roles and departments.

Data Storytelling with Power BI Dashboards

ComicGen

Create and embed engaging and memorable comic characters in your data stories on Power BI

Drilldown Chloropeth

Explore deep geographic data, plot thousands of items and drill down their data hierarchy

Drilldown Cartogram

Display hierarchical maps set as a circle for each location, with size/color from specified values

img

Here’s what our clients have to say

Power BI + Gramex Advantage:
Helping you build data applications you need

We have built a vast intersection of applications

  • RPA Command Center
  • Intelligent Patent Miner
  • Fraud Network Detector
  • Project Control Center
  • Sales Force Monitor
  • Attrition Predictor
  • Trade Flow Analyzer
  • Election Theater
  • Supply Chain Optimizer
  • Store Inventory Forecaster
  • Ad Spend Optimizer
  • Customer Churn Predictor

Our Resources

How to Create Comic Data Stories in Power BI Dashboards

Gramener offers a wide range of Power BI Services for businesses, which also includes workshops and training to create dashboards in Power BI.

How to Unlock Storytelling with Power BI and Comicgen plugin

If you are a Power BI analyst or a dashboard developer, Comicgen can help you create amazing narratives to fuel your insights.

Power BI to Optimize your Media Buying & Ad Performance Experience

If you are someone from the Media industry or an Agency helping Brands with their ad, this webinar is for you.

Schedule a Demo with us

Learn why 150+ enterprises worldwide trust Gramener as their Data & AI partner
ISO-
for-footer
Schedule a Demo