Business reports can be boring and your stakeholders can miss out on actionable insights if they lack a human touch.
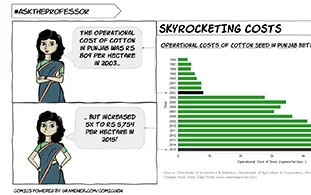
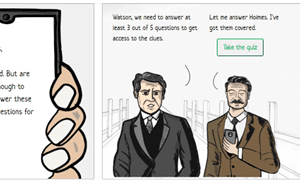
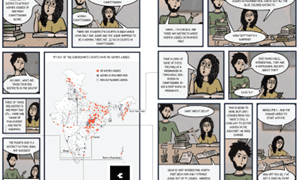
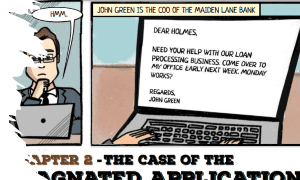
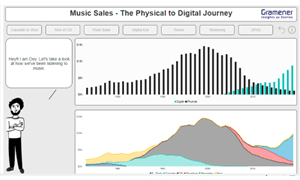
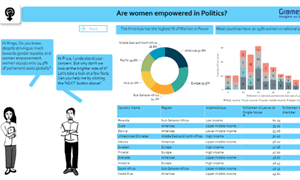
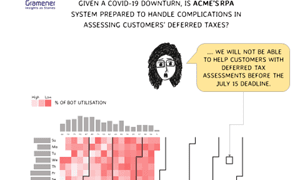
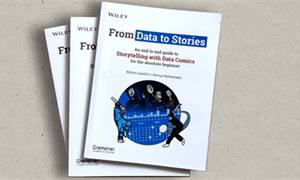
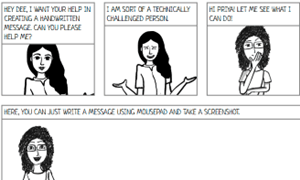
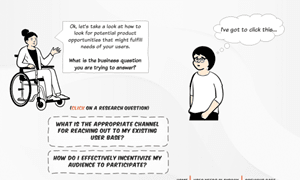
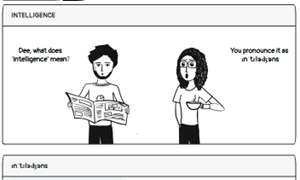
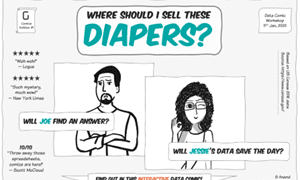
It’s time you tried the ‘data comic stories’ approach. Our book ‘From Data to Stories’ shows how comics and data visualization combine well to help narrate insights as engaging stories.
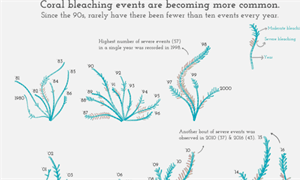
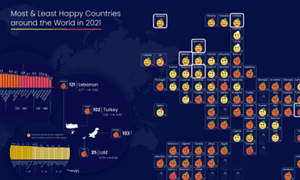
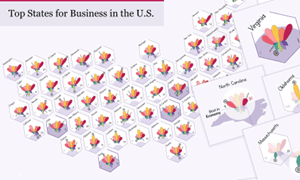
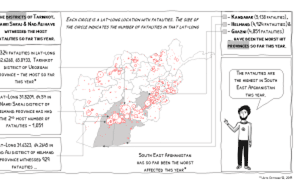
Physical data visualizations are made using tangible elements such as threads, beads, etc. Here are some lessons learned from creating physical data visualizations.
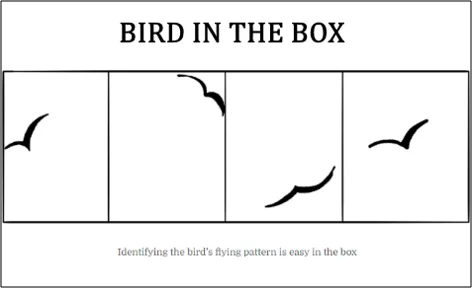
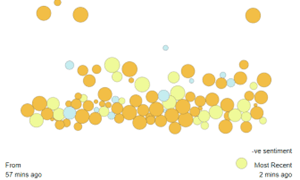
Let’s take the bird inside the box scenario. The bird is flying but it’s always inside the box. This makes it easy to track it’s flying pattern by the observer.
Let’s take the bird inside the box scenario. The bird is flying but it’s always inside the box. This makes it easy to track it’s flying pattern by the observer.
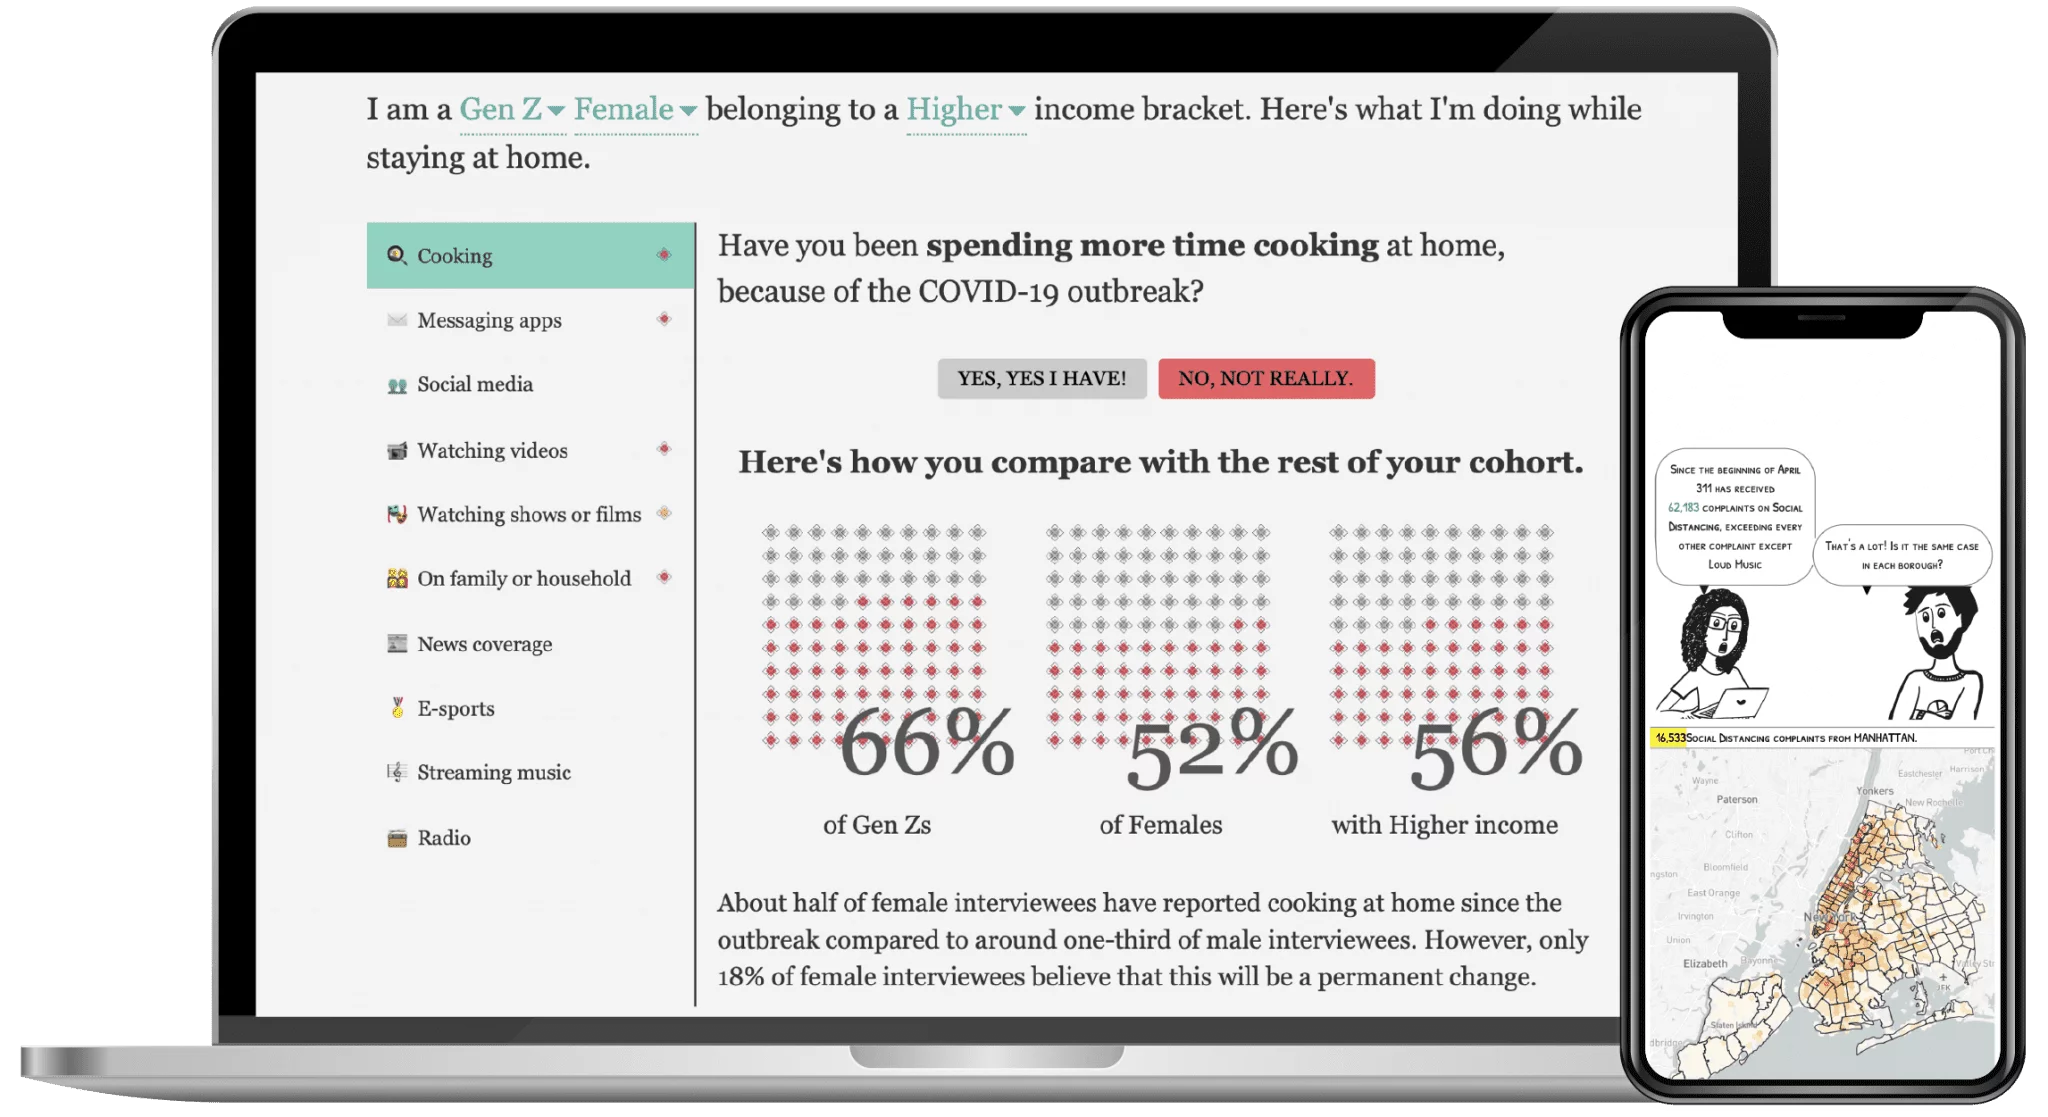
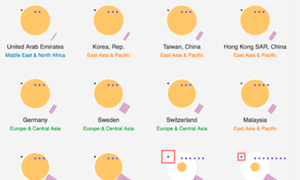
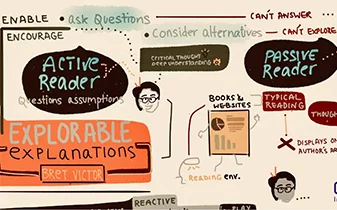
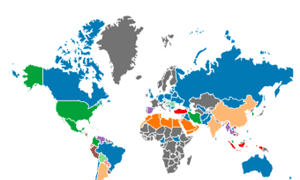
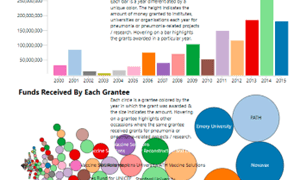
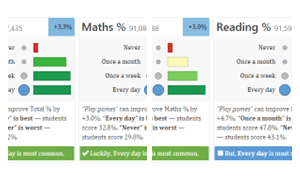
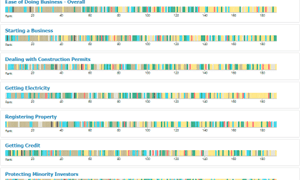
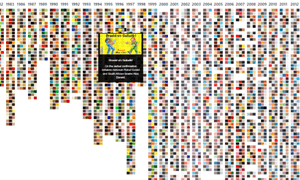
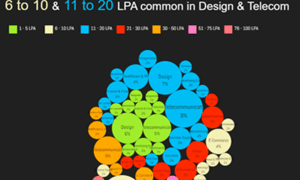
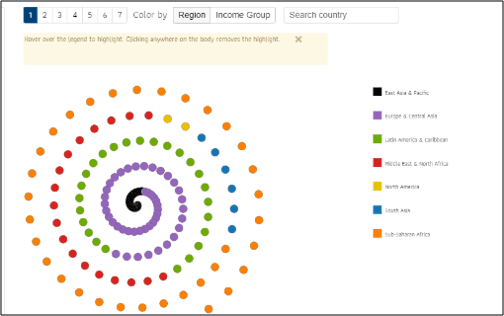
Reading Research Reports Should Never Be A Drudge. It Needs To Be A Joyful Experience, And We Did Just That For The World Bank. Our Story On Tech Entrepreneurship Gives The Reader A Visual Experience Of Insights Coupled With The Traditional Reading Format Of The Web.
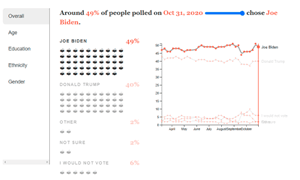
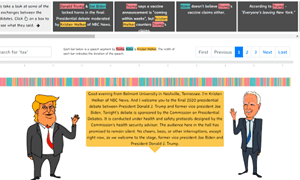
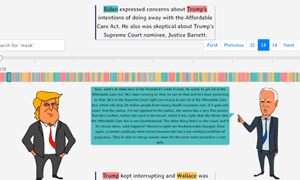
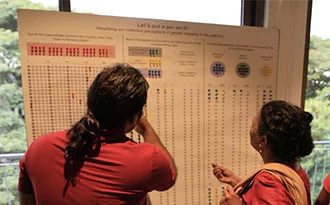
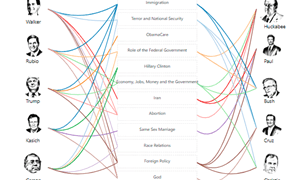
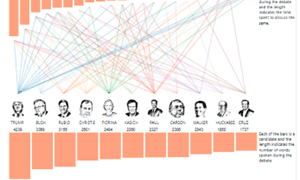
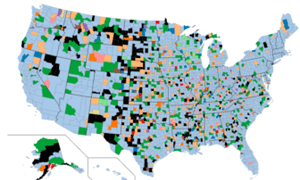
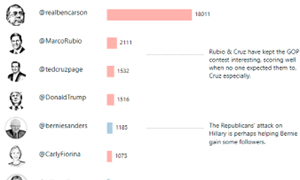
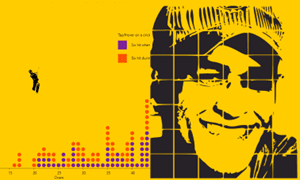
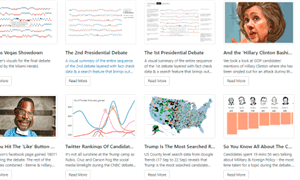
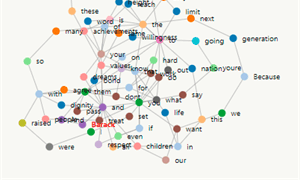
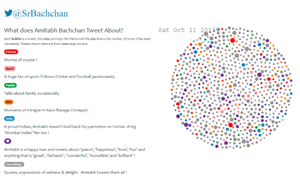
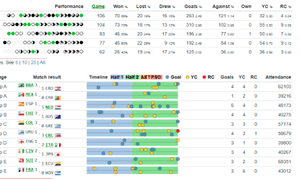
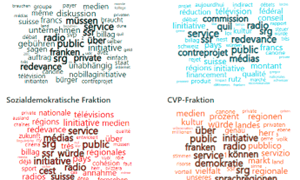
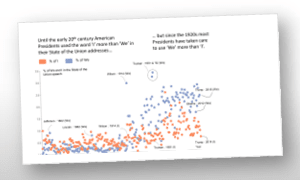
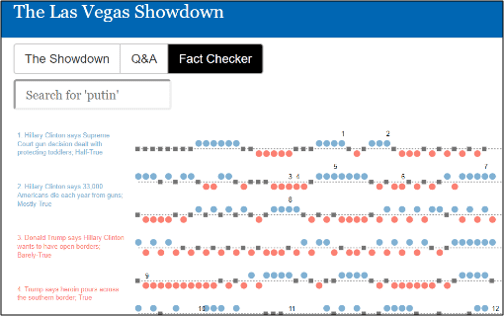
Many Things Go Unnoticed During A Live TV Debate. Finding Patterns For Partially Structured Texts And Communicating Them As Stories Is A Need For Media Houses. We Helped The Miami Herald Achieve That For The Presidential Debates Of 2016. Check Out The Story.