Use your data for business success
Data-driven products that solve your everyday business problems effectively
Slidesense
PPT automation for data-driven reporting
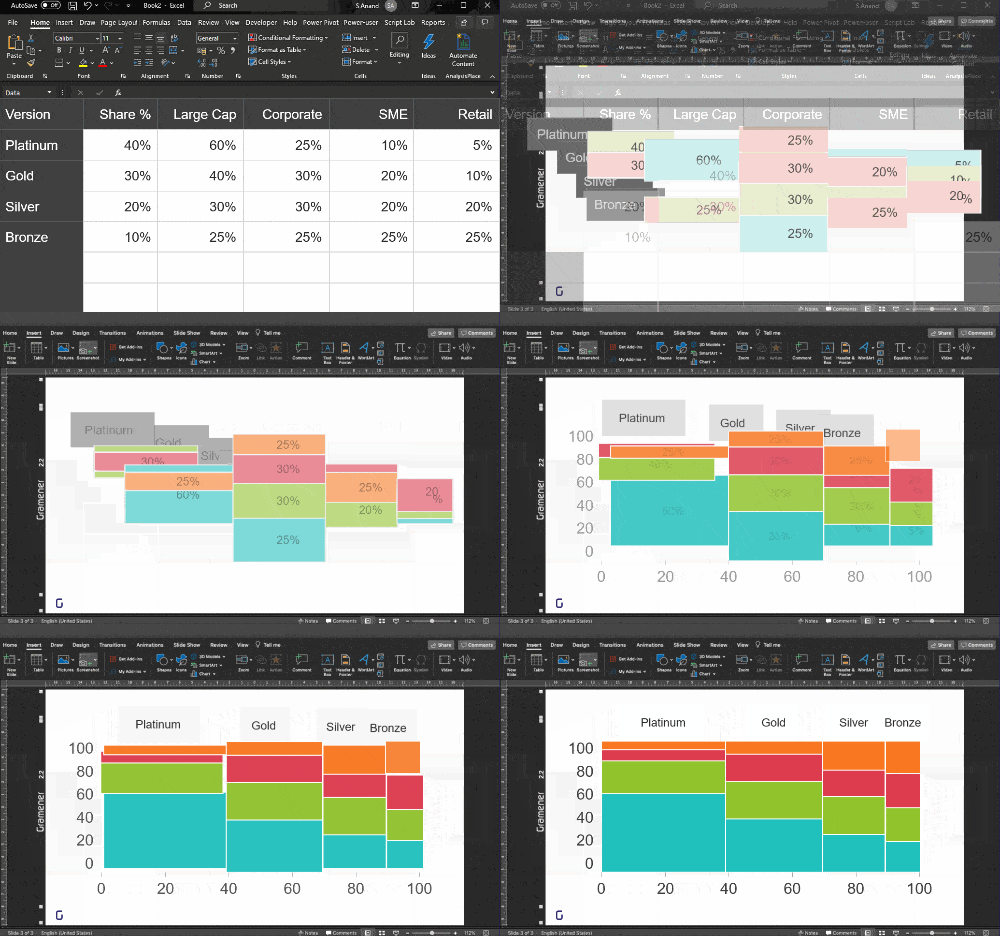
Automate your reporting tasks with Slidesense – an easily integrable PPT BOT that will create your PPT reports with creative visualization, insights, and drill-down capabilities.
Slidesense is perfect for companies who have frequent reporting requirements, both internally and externally.

Intelligent Document Processing
Doc Genie is Gramener’s Intelligent Document Processing solution based on Optical Character Recognition (OCR) and Generative AI to help organizations classify documents, extract unstructured data, and store the output.
It includes Contributor Module for delivering highly accurate data extraction from various document types, completely automating and accelerating document processing from start to finish.
Insight Tree
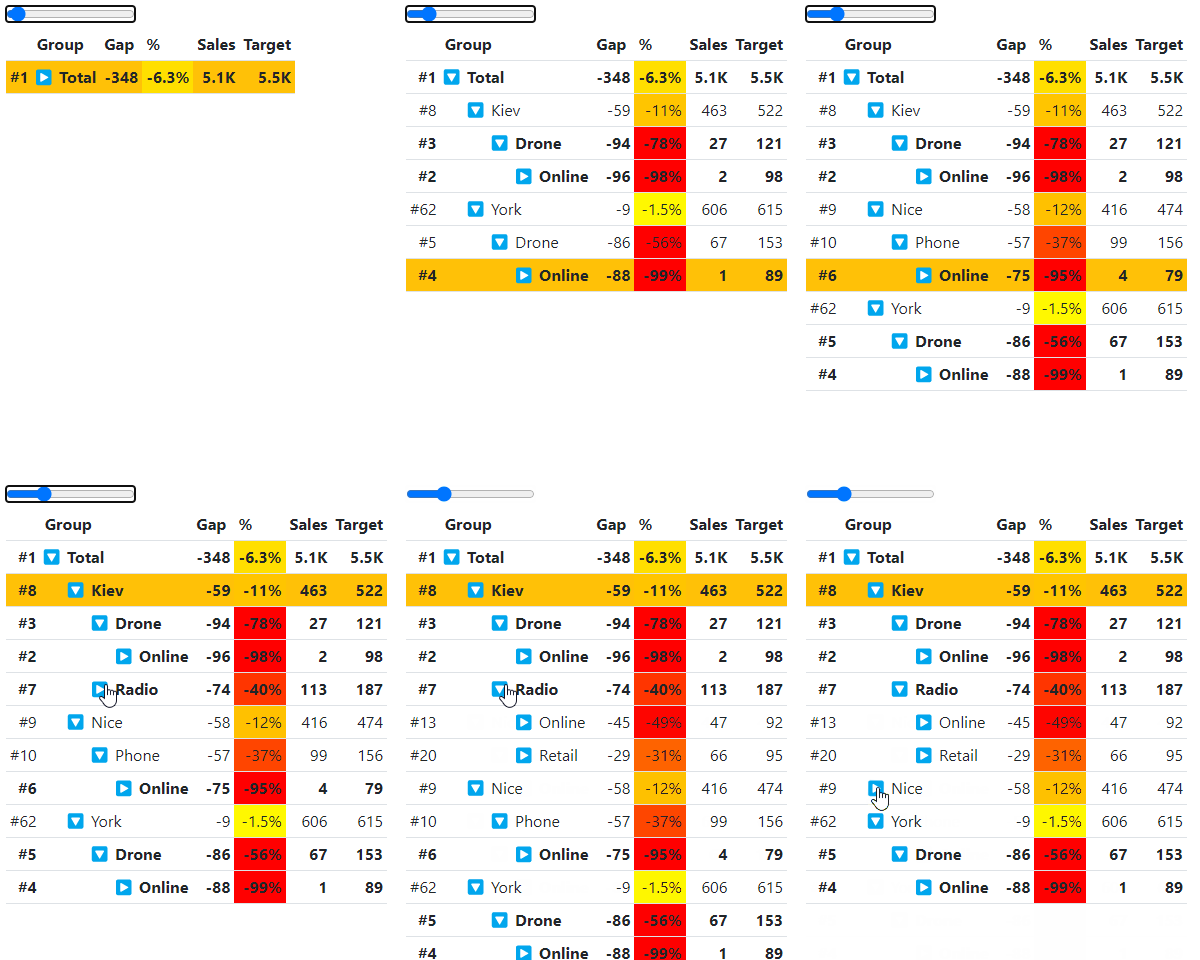
Drill down the exact reason for your missed targets!
Insight Tree is designed to address the critical need to understand the reasons behind missed targets in key metrics, such as sales. The complexities of interrelated performances can often obscure the root cause. Insight Tree steps in to automate this crucial drill-down process by meticulously examining every combination in the hierarchical structure allowing you to navigate through layers of data efficiently and pinpoint the underlying factors impacting overall performance.
Insight Tree works perfectly for Sales & Marketing teams and leadership of B2C organizations across domains such as retail, CPG, consumer durables, etc.
AInonymize
Overcome data anonymization challenges with AInonymize
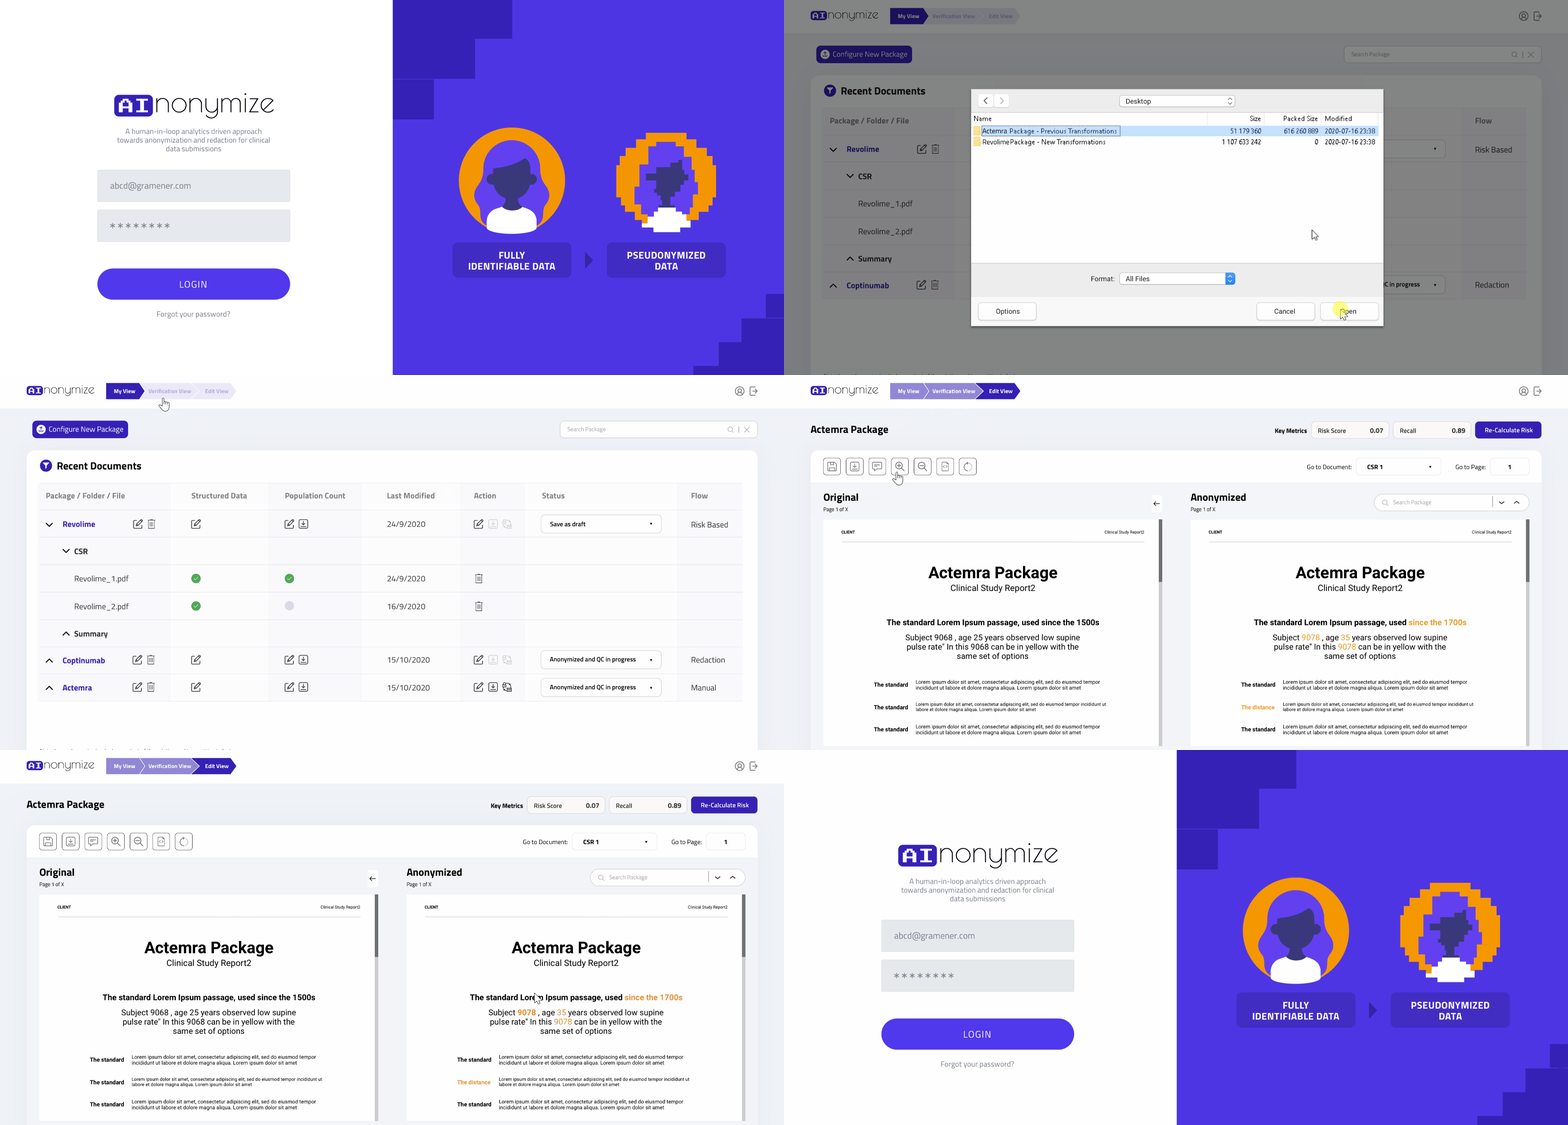
With AInonymize, you can achieve clinical report submission timelines with ease. Built using state-of-the-art expert algorithms and technology, the AI solution is designed to simplify and streamline the data anonymization process for clinical trial report submissions, while ensuring strict compliance with data privacy regulations.
AInonymize is specifically made for pharmaceutical companies involved in clinical trials, and R&D.

Cluster Analysis
Segment your customer data behaviorally
Gramener’s Cluster Analysis tool lets you group your customer data into segments that behave similarly. That way, you know what to offer to which segment, simplify the marketing mix so you can target your offerings accurately to more homogenous segments.
With Gramener, our data visualization and analytics reached new heights, driving innovation and driving our business ahead. Invaluable solutions that deliver results.

VP, Analytics & Insights
A leading pharma companyGramener’s products transformed our data chaos into actionable insights, boosting efficiency and decision-making. A game-changer for our business!

Head of IT
A leading computer hardware companyGramener’s SlideSense product has allowed Scripps to produce PowerPoint deliverables for our Local Media division at scale, empowering us to shift analyst workloads to higher value activities across our portfolio of 61 local television stations in 41 markets.


