Decoding U.S. Elections 2020 with visual data stories
Debate analysis, voting intentions, and more!
Data analysis and visualization have become the cornerstone of elections today. Data offers an evidence-based, neutral view of what’s happening and why. At Gramener, we drive the decipher the buzz around the U.S. Presidential Elections 2020 by giving you visual-driven data stories for you to check out and be aware of electoral issues. Here’s what we have for you.
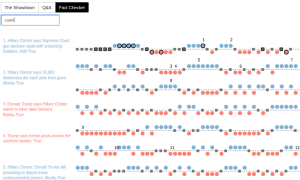
Interactive exploration of debates. Find out what the candidates said about an issue that interests you.
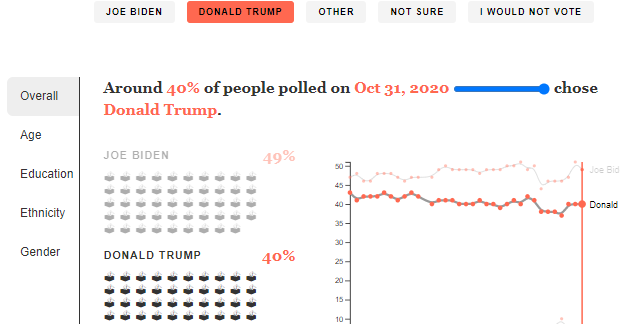
Explorable Narratives: Visual breakdown by demographic and other factors
Make sure you mail in your votes or go out and vote on 3rd November, 2020!
Debate analysis, voting intentions, and more!
The Supreme Court, Covid-19 And More
How Often Did The Candidates Say Words That Are Important To You? Find Out In This Comic-Driven Interactive.