PPTXHandler generates PPTX
New in v1.23. PPTXHandler creates PPTX files using a configuration and an existing PPTX as a template. The result is a new PPTX that the user can download.
Here is an example of a simple text substitution:
url:
  pptxhandler/ppt:
    pattern: /$YAMLURL/ppt
    handler: PPTXHandler
    kwargs:
      only: 1
      source: $YAMLPATH/input.pptx # Input file to load
      change-text: # First rule is called change-text
        Title 1: #   Find all shapes named "Title 1" in all slide number 1
          text: Generated by Gramex #   Replace their text
      headers:
        Content-Disposition: attachment; filename=output.pptx
Note: all examples use specific slides from examples-input.pptx
The rules are based on the PPTGen API which is described below.
PPTGen
PPTGen lets you modify the contents of a PowerPoint presentation based on data. For example, you can:
- Update charts, images and text from data
- Create a series of slides using a template from spreadsheets or database
It is a command line utility and a Python function packaged with Gramex. It forms the basis of PPTXHandler.
PPTGen Library
The PPTGen library accepts a configuration as its argument. For example:
from gramex.pptgen import pptgen
pptgen(
  source='input.pptx',      # optional path to source. Defaults to blank PPT with 1 slide
  target='output.pptx',     # optional target. Otherwise, returns the pptx.Presentation()
  change={                  # Configurations are same as when loading from the YAML file
    'Title 1': {            # Take the shape named "Title 1"
      'text' 'New Title'    # Replace its text with "New Title"
    }
  }
)
Here is another example that changes a bar chart based on data:
import pandas as pd
from gramex.pptgen import pptgen

data = {'chart_data': pd.read_csv('data.csv')}
pptgen(
  source='input.pptx',
  target='output.pptx',
  edit_chart={
    'Bar Chart Shape Name': {
      'chart': {
        'data': data['chart_data'],
        'x': 'Category',
        'size': 'PreY',
        'color': {
          'function': "{'CurY': '#D73027', 'PreY': '#1A9850', 'PPresY': '#FFFFBF', 'Size': '#cccccc'}"
        }
      }
    }
  }
)
PPTGen Configuration
The configuration accepts the following top-level keys:
source:required. Path to input / source PPTX.target:optional. Path where output / target PPTX is saved. If None,pptgenreturns the Presentation object.data:optional dataset or a dictionary. This is described below.only:Accepts slide number or list of slide numbers starting from 1. If defined, in output presentation only selected slides will be available. Suppose there are 10 slides in a presentation but user has defined1underonlysection then only slide number 1 will be available in output, similarly slide number 1 and 2 will be available in output presentation ifonly: [1, 2].register:Optional to register any new custom commands to pptgen. It accepts a function which accepts three parametershape,spec, anddata. Availableimmutablecommands in pptgen arecss,text,image,chart,table,sankey,bullet,replace,treemap,heatgridandcalendarmap.- All other keys are treated as rules that are described below.
Data
PPTGen can change presentations with data from various sources. It uses
gramex.data.filter. It supports these keys:
url:Pandas DataFrame, sqlalchemy URL or file nameext:file extension (if url is a file). Defaults to url extensionargs:optional filters to apply to dataset. Passed as a dict of liststable:table name (if url is an SQLAlchemy URL)query:optional SQL query to execute (if url is a database)transform:optional in-memory transform. Takes a DataFrame and returns a DataFrame.- Any additional keys are passed to
gramex.cache.openorsqlalchemy.create_engine.
Example:-
data:
  cities: { url: cities.csv } # Load cities.csv into "cities" key
  sales: { url: sales.xlsx, sheet: Sheet1 } # Load Sheet1 from sales.xslx into "sales" key
  tweets: { url: tweets.json } # Load JSON data into "tweets" key
  sample: { url: mysql://server/db, table: sample } # Load sample data from MySQL
  filter:
    url: cities.csv # Load cities.csv
    args: # Filter results
      Country: [Egypt, Sudan] # WHERE column Country is Egypt or Sudan
      Population>: 100000 # AND column Population is 100,000+
Rules
The configuration can define any number of rules. Rules have:
- one or more shape names, and the list of commands to apply to those shapes.
- an optional slide selector that restricts which slide they apply to. By default, rules apply to all slides.
In the example below, there is 1 rule called change. It does no slide selector,
so it applies to all slides. It has 1 shape: Title 1 with 1 command: text:
source: input.pptx # optional path to source. Default to blank PPT with 1 slide
target: output.pptx # required path to save output as
change:
  Title 1: # Take the shape named "Title 1"
    text: New Title # Replace its text with "New Title"
Slides
By default, changes are applied to all slides. To restrict changes to a specific slide, use:
slide-numberslide number or list (with the first slide as slide 1).slide-titleis a regular expression that matches the slide title.
source: input.pptx
target: output.pptx
rule-1:                 # rule-1 applies to all slides
  ...
rule-2:
  slide-number: 1       # rule-2 applies only to the first slide of the source
  ...
rule-3:
  slide-title: Hello    # rule-3 applies to slides with the title "Hello" (regex)
  ...
  ...
To create multiple slides from data, add data: to the change. For example:
data:
  sales: { url: $YAMLPATH/sales.csv }
change:
  data: data['sales'].groupby('Category')
  replicate: True
  sales-text: # Take the shape named "sales-text"
    data: data[0]
    text: "Region {{ Category }} has sales of {{ Sales }}"
This data: is an expression using the root data: variables.
It can be used with
slide-numberto repeat 1 or more slides. For exampleslide-number: [1,2]will copy slides 1 & 2 as many times as there are rows of dataslide-titleto repeat individual slides or multiple single slides
Slide numbers always refers to the source slide number, not the target slide number. Even if a slide is duplicated in the target, source slide numbers do not change.
Shapes
In PowerPoint, all shapes have names. To see shape names, select Home tab > Drawing group > Arrange drop-down > Selection pane. Or press ALT + F10.
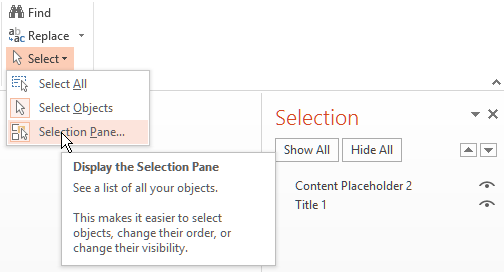
To change the shape names, double-click on the name in the selection pane.
You can specify changes to one or more shapes in a rule. For example:
rule-1:
  Title 1: # Shape name "Title 1" will be updated by text "New title"
    text: New title
    style: # Text color will be `red`(accepts only hex color code in 6 digit)
      color: "#ff0000"
  Text 1: # Shape name "Text 1" will be updated by text "New text"
    text: New text
    style: # Text color will be `green`(accepts only hex color code in 6 digit)
      color: "#00ff00"
      bold: True # Text will appear in bold
… changes 2 shapes named Title 1 and Text 1.
Shape names may refer to native elements or groups.
Groups
Shape names may refer to groups. To change groups’ contents, use a nested
configuration. For example, if “Group 1” has “Caption” and “Picture” inside it,
this config-group.yaml replaces those:
source: input.pptx
target: output.pptx
change-image:
  Group 1: # Take the shape named "Group 1"
    Caption: # Find the shape named "Caption" inside it
      text: New caption #   Change its text to "New caption"
    Picture: # Find the shape named "Picture" inside it
      image: $YAMLPATH/sample.png #   Replace the image with sample.png
PPTX URL arguments
URL arguments can be used as variables in templates.
In the example below, group-args-example?text=My-Text,
will replace text with My-Text
Caption: # Find the shape named "Caption" inside it
  text: "{{ args['text'] }}" #   Change its text to ?text=
Picture: # Find the shape named "Picture" inside it
  image: $YAMLPATH/{{ args.get('image', 'sample') }}.png # Replace image with ?image= or sample.png
Commands
Shapes can be changed using 1 or more commands. These commands can change the shape’s style and content, or add new content (like charts).
Register: Register a new command to PPTGen
Register let you create a custom command. It accepts a function which will accepts three parameters, shape, spec(configuration for a shape, config under the shape name), data in same order. It will not accept any other parameter except these 3. Any existing command can not be overwrite. Return an immutable command list.
source: input.pptx
target: output.pptx
data:
  load_data: { url: data.csv }
register:
  custom_command1: view.custom_command1 # Registering a new command as `custom_command1.`
  custom_command2: view.custom_command2 # Registering a new command as `custom_command2.`
  custom_command3:
    function: view.custom_command3 # Registering a new command as `custom_command3.`

custom-config: # Rule
  Shape Name 1: # Shape Name
    custom_command: ....    Configuration
  Shape Name 2:
    custom_command2: ....    Configuration
  Shape Name 3:
    custom_command3: ....    Configuration
CSS
The following CSS-like commands change the shape’s display attributes:
data: Loads datastyle: Accepts css like propertiesopacity: sets the shape’s opacity level as a decimal from 0 - 1color: sets the text / foreground color as CSS colorsfill: sets the shape’s background color as CSS colorsstroke: sets the shape outline color as CSS colorswidth: sets the shape width in pointsheight: sets the shape height in pointsleft: sets the shape X position in pointstop: sets the shape Y position in pointsfont-size: sets the font size in pointsfont-family: sets the font family as a font name
Example:
Rectangle 1: # Take the shape named "Rectangle 1"
  css:
    data: data['sales']
    style:
      opacity: 0.5
      color: "#ff0000"
      fill: "#ffff00"
      stroke: "#ffff00"
      width: 200
      height: 200
      left: 50
      top: 100
CSS colors can be specified in the same way they can in CSS.
1 point is 1/72 inches. All style elements and data will accept python expression or python function.
Values support expressions.
Text
To change the title on the input slide to “New title”, use this configuration:
      Title 1:                # Take the shape named "Title 1"
        style:                # CSS like properties only for text
          color: '#ff00000'   # Text color will be red
          font-size: 12       # Setting font-size
          .......
        text: New Title       # Replace its text with "New Title"
text: values support templates. Also supports style css like properties for text under shapename.style section. All style sub-elements accepts python functions also.
text: supports xml objects in input text(which suppose to get replaced with) to have a css properties for a word in a sentence or phrase. e.g.-
      Title 1:                # Take the shape named "Title 1"
        style:                # CSS like properties only for text
          color: '#ff00000'   # Text color will be red
          font-size: 12       # Setting font-size
        text: "New Title <text color="#00ff00" bold="True"> Colored Bold Text </text>"
In above example shape with name Title 1 will get replaced by New Title in green color and Colored Bold Text will be bold in red color. It accepts only text tag in xml input. Input xml template can have multiple text tag.
Replace
To substitute text instead of replacing the full text, use:
Title 1: # Take the shape named "Title 1"
  style:
    color: "#ff0000" # All new replaced text will have red color
    font-size: 12 # All new replaced text will have font-size 12
    Old:
      color: "#00ff00" # Overwriting common css for text `Old` that is being replaced with `New`
  replace: # Replace these keywords
    "Old": "New" #   Old -> New
    "Title": "Heading" #   Title -> Heading
Replacement only works for words that have the same formatting. For example, in
somewhere, “where” is underlined. You cannot replace “somewhere”. But you can
replace “some” and “where” independently. It also supports css like properties under shapename.style. All style elements accepts python functions as well.
replace: values support templates.
Image
To change the picture on an image, use:
Picture 1: # Take the shape named "Picture 1"
  image: $YAMLPATH/sample.png # Replace the image with sample.png
image: values support template, and can be a URL or file path.
Table
Modifies existing tables. It accepts these keys:
data:optional data expression to render as the table. The table expands on shrinks to accommodate the rows and columns in the data.style:optional common css for all columns. E.g.- color, fill, font-size etc. These properties can be overwrite inside a column. If not then property will be common for all columns.bold:True or False, if True text will be show in bold.fill:Color of the cells.color:Text color.italic:To set text’s itallic style.underline:To set text’s underline style.font-size:Font size of text.font-family:Text’s font family.gradient:optional gradient name (binary, Blues, BuGn, BuPu, gist_yarg, GnBu, Greens, Greys, Oranges, OrRd, PuBu, PuBuGn, PuRd, Purples, RdPu, Reds, YlGn, YlGnBu, YlOrBr, YlOrRd, BrBG, bwr, coolwarm, PiYG, PRGn, PuOr, RdBu, RdGy, RdYlBu, RdYlGn, seismic).min:optional minimum. Defaults to the column’s min valuemax:optional maximum. Defaults to the column’s max value
columns:A dictionary config for the columns. Inside this style properties can be defined and can overwrite common styles fromstylesection. Only defined columns insidecolumnssection will get populated inside table.
Example:
columns:
  Category: {} # Not overwriting common css styles but Category column will be shown in table
  Sales: # Defining style for Sales column
    gradient: Greens
    font-size: 14
  Profit: # Defining style for Profit column
    font-family: Georgia
Example:
source: example-input.pptx
data:
  table_data: { url: $YAMLPATH/sales.csv }
new-edit-table:
  Table 1: # Shape Name
    table:
      data: data['table_data']
      style: # Common CSS for all the cells
        font-size: 14
        text-align: center
        italic: True
        underline: True
      columns:
        Sales: # Common CSS will get over-write for Sales column
          gradient: Reds
        Profit:
          gradient: Greens
        Growth:
          gradient: Blues
        Category: # Common CSS will get over-write for GrossProfit column
          bold: False
          underline: False
          italic: False
Replicate
To create multiple shapes using data, use replicate: and data:. For example:
data:
  replicate_data: { ext: json, url: $YAMLPATH/tweets.json }
multiple-objects: # Rule
  # Slide 1 will get replicated for all Categories (that is unique groups from groupby below),
  # if slide-number is defined else all slides will get replicated.
  data: data['replicate_data']
  replicate: True # Entire rule will replicate for defined slides
  TextBox 1:
    text: "Tweet id is- {{id_str}}, Username:- {{ user['name'] }}"
Stack
Replicate a shape multiple times based on data vertically or horizontally. For example:
data:
  sales: { url: $YAMLPATH/sales.csv }
multiple-objects: # Rule
  TextBox 1: # Take the "TextBox 1" shape
    data: data['sales'].to_dict(orient='records')
    stack: vertical # Lay the images out horizontally to the right
    margin:
      0.10 # Should be between 0-1. Default 0.15(15%)
      # Percentage of margin from shape's height if stack is `vertical` else width.
    text: "{{ Category }}: {{ Sales }}" # Change the text using this template
This data: is an expression using the root data: variables.
For each row in data, the shape is duplicated and laid out based on replicate:.
stack: supports these layouts:
horizontalcopies the element right with an optionalmargin(default: 0)verticalcopies the element below with an optionalmargin(default: 0)
Templates
For commands that support templates, values inside {{ ... }} are evaluated as
Python expressions in the context of data.
For example:
data:
  tweets: { ext: json, url: $YAMLPATH/tweets.json }
change:
  Title 1:
    text: "Tweet from @{{ tweets[0]['user']['screen_name'] }}"
… will replace the contents inside {{ ... }} with the value of
tweets[0]['user']['screen_name'] evaluated in Python. The variable tweets is
the result of loading tweets.json.
Expressions
For commands that support expressions, values are evaluated as Python expressions in the context of data. For example:
data:
  tweets: tweets.json
change:
  slide: 1
  data: sales.groupby('city') # replicates slide 1 for every item in sales.groupby('city')
Deprecated commands
Chart
Edits the data inside native pptx charts. combo pptx charts are not supported. chart accepts following attributes:-
Note:- All attributes also accepts python expression or custom function. Such as:-
    chart:
      data:
        function: module.functionname
      color:
        function: module.functionname
      ....
data: Pass data to chart.
usecols: list type. If defined, only the columns mentioned in the list will pass through as data to the charts .Accepts function: python expressions or a list of column names.
x: Define x-axis column name from data.
size: This is applicable only for Bubble Charts. Column name from data for bubble size.
color: Accepts a dictionary (or raw value as well in this case same color code will be get apply for all series) for the series that are being added to the charts. Also provide row level data access to the series using lambda function. E.g.:-
    chart:
      color:
        function: module.color_function
      # --------- If chart type is not a PIE or DONUT -----------------
      # In this case you will not have row level access. `color_function` must return a dictionary with keys of series name along with color code value.
      # --------- If chart type is PIE or DONUT -----------------
      # `color_function` must return a dictionary with keys `x-axis` columns unique value along with color code value.

    # Case 2
    chart:
      color:
        function: "lambda x: module.color_function"
      # In this case you will have row level data access. `color_function` will have 3 input parameters

      # --------- If chart type is not a PIE or DONUT -----------------
      # `handler`, `name` and `row`. `name`(series name - x axis value name for that point), `row` dictionary of row for that point includes all the columns as key, value pair.
      # --------- If chart type is not a PIE or DONUT -----------------
      # `handler`, `name` and `row`. `name`(series name), `row` dictionary of row for that point includes all the columns as key, value pair.
      # In this case `color_function` function must return a hex color code, not a dictionary.
stroke: Same configuration like color.
opacity: Same configuration like color.
Native charts
To modify the data and attributes for an existing native chart, use chart:.
This supports the following chart types:
Bar charts:Clustered Bar, Stacked Bar, 100% Stacked BarColumn charts:Clustered Column, Stacked Column, 100% Stacked ColumnLine charts:Line, Stacked Line, 100% Stacked Line, Line with Markers, Stacked Line with Markers, 100% Stacked Line with MarkersArea charts:Area, Stacked Area, 100% Stacked Area (3D area not supported)Scatter charts:Scatter, Scatter with Straight Lines, Scatter with Smooth Lines, Scatter with Straight Lines and Markers, Scatter with Smooth Lines and MarkersBubble charts:Bubble, 3-D BubbleRadar charts:Radar, Radar with Markers, Filled RadarDonut charts:Doughnut, Doughnut ExplodedPie charts:Pie, Pie Exploded, Bar of Pie (3D pie not supported)
Here are examples that assume the following configuration:
source: input.pptx # This must already have the relevant chart
target: output.pptx
data: # This dictionary is available to all charts as "data"
  sales: { url: sales.csv } # The examples assume a dataset called "sales"
Here are examples for various charts:
edit-charts: # Rule name
  Bar Chart Name:
    chart:
      data: data['sales'][['Category', 'Sales', 'Profit', 'Growth']]
      x: Category
      color: # Define colors
        Sales: "#D73027" # Specify color of sales line in 6-digit hex
        Profit: "#1A9850" # Specify color of profit line
        Growth: "#cccccc" # Specify color of profit line
Column Chart Name:
  chart:
    data: data['sales'][['Category', 'Sales', 'Profit', 'Growth']]
    x: Category
    color: # Define colors
      Sales: "#D73027" # Specify color of sales line in 6-digit hex
      Profit: "#1A9850" # Specify color of profit line
      Growth: "#cccccc" # Specify color of profit line
Line Chart Name:
  chart:
    data: data['sales'][['Category', 'Sales', 'Profit', 'Growth']]
    x: Category
    color: # Define colors
      Sales: "#D73027" # Specify color of sales line in 6-digit hex
      Profit: "#1A9850" # Specify color of profit line
      Growth: "#cccccc" # Specify color of profit line
Area Chart Name: # Name of the chart shape. Case sensitive
  chart:
    data: data['sales'][['Category', 'Sales', 'Profit', 'Growth']] # Use sales data
    x: Category # The x-axis is the Category column. Other columns are Y-axis values
    color: # Define colors
      Sales: "#D73027" # Specify color of sales line in 6-digit hex
      Profit: "#1A9850" # Specify color of profit line
      Growth: "#cccccc" # Specify color of profit line
    opacity: 0.50 # Constant opacity for all lines
Scatter Chart Name:
  chart:
    data: data['sales'][['Category', 'Sales', 'Profit', 'Growth']]
    x: Category
    color: # Define colors
      Sales: "#D73027" # Specify color of sales line in 6-digit hex
      Profit: "#1A9850" # Specify color of profit line
      Growth: "#cccccc" # Specify color of profit line
Bubble Chart Name:
  chart:
    data: data['sales'][['Category', 'Sales', 'Profit', 'Growth']]
    x: Category
    size: Growth # Optional: Column name from data for the size of the bubbles, if not defined default size will be 1
    color: # Define colors
      Sales: "#D73027" # Specify color of sales line in 6-digit hex
      Profit: "#1A9850" # Specify color of profit line
      Growth: "#cccccc" # Specify color of profit line
Bubble Chart Name 3D:
  chart:
    data: data['sales'][['Category', 'Sales', 'Profit', 'Growth']]
    x: Category
    size: Growth # Optional: Column name from data for the size of the bubbles, if not defined default size will be 1
    color: # Define colors
      Sales: "#D73027" # Specify color of sales line in 6-digit hex
      Profit: "#1A9850" # Specify color of profit line
      Growth: "#cccccc" # Specify color of profit line
Radar Chart Name:
  chart:
    data: data['sales'][['Category', 'Sales', 'Profit', 'Growth']]
    x: Category
    color: # Define colors
      Sales: "#D73027" # Specify color of sales line in 6-digit hex
      Profit: "#1A9850" # Specify color of profit line
      Growth: "#cccccc" # Specify color of profit line
Donut Chart Name:
  chart:
    data: data['sales'][['Category', 'Sales']]
    x: Category
  color: # Define colors
    FMCG: "#64A73B"
    Media: "#71685C"
    Banking: "#EB5605"
    Government: "#B9CA1A"
    Pharmaceutical: "#CCDDEA"
Pie Chart Name:
  chart:
    data: data['sales'][['Category', 'Sales']]
    x: Category
    color: # Define colors
      FMCG: "#64A73B"
      Media: "#71685C"
      Banking: "#EB5605"
      Government: "#B9CA1A"
      Pharmaceutical: "#CCDDEA"
The following keys can also be specified as an expression and python functions:
data:, x:, color:, opacity:, size:.
For example, this example sets the opacity of columns named “dummy” as 0.2, and other columns as 1.0.
opacity:
  function: '{col: 0.2 if "dummy" in col else 1.0 for col in data.columns}'
Custom charts
pptgen lets you create these custom charts:
- Bullet chart
- Calendarmap
- Heatgrid
- Sankey
- Treemap
To create these, add a rectangle shape (no other shape is allowed) in your slide. When a custom chart is applied on that rectangle, it replaces the rectangle with the chart.
Bullet
data:Actual value.poor:Poor value.good:Good value.target:Target value.max-width:Sets maximum width of rectangle. Acceptsfunctionor raw value(between 0-1).gradient:Optional. DefaultRdYlGn.text:DefaultTrue. Optional, if present text will be shown as per format. Text can be overwrite insidestyle.data.textorstyle.target.textsection if defined there.style:Optionaldict, accepts css propertiese.g:- font-color, fill, opacity etc.
Example:
data:
  sales: { url: $YAMLPATH/sales.csv }
draw-bullet:
  Bullet Rectangle:
    bullet:
      data: data['sales']['Sales'].ix[0]
      poor: 0
      good: 30
      target: 100
      average: 60
      orient: horizontal
      gradient: "Oranges"
      text:
        function: "lambda v: '%.1f' % v"
      style:
        font-size: 10 # Common css for all items(data, target, poor, good and average)
        color: "#ff0000"
        data: # Overwriting CSS for data
          font-size: 12
          fill: "#ff00ff"
        target: # Overwriting CSS for target
          text: False # Overwriting text for text. Text will not be shown
          font-size: 12
          color: "#cccccc"
The following keys can also be specified as an expression and python functions:
data:, target:, poor:, good:, average:, gradient, text along will all style properties such as under style section font-size, opacity, fill, color etc.
Calendarmap
width:Width and height of each cell(in pixel) in calendarmap.weekstart:Weekstart valuedate.gradient:Optional, defaultRdYlGn.format:Number format to be shown in top/left bar iflabel_top/lebel_leftdefined.lo:Min value for color scaledefault min from data.hi:High value for color scaledefault max from data.label_top:Top margin for the calendermapdefault 0.label_left:Left margin for the calendermapdefault 0.style:Adict, acceptsCSSproperties e.g-color, fill, opacity, font-size, etc.
Example:
data:
  calendar:
    {
      url: $YAMLPATH/calendarmap.csv,
      parse_dates: ["date_time"],
      encoding: "utf-8",
    }
draw-calendar:
  Calendar Rectangle:
    calendarmap:
      data:
        function: data['calendar'].sort_values(by=['date_time']).set_index('date_time')['random_column']
      width: 35
      weekstart: 6
      label_top: 40
      label_left: 40
      text-color: "#000000"
      startdate: data.index[0]
The following keys can also be specified as an expression and python functions:
data:, startdate:, lo:, hi:, weekstart: and subelements of style section.
Heatgrid
data:A DataFrame.row:Columns name from data which will be get treated asrowin heatgrid.column:Columns name from data which will be get treated ascolumnin heatgrid.column-order:optional, list of unique values(from heatgrid column from data). In the same order columns will get created in heatmap. Acceptsfunction: python expression underas well.row-order:optional, same likecolumn-orderbut for rows.value:Columns name from data to show for each cell heatgrid.text:falseis the default. It does not show any texttrue, shows thevaluecolumn{function: data['label']}shows custom text from thelabelcolumn{function: module.method(data, handler)}can be any function/expression usingdatawhich is the row, andhandlerdata(which is the row) andhandler.
left-margin:In percentage(0-1) of total width of shape. Left margin from the shape from where heatgrid will start populating.cell-width:Width of each cell. Default based on columns width of shape will defined.cell-height:Height of each cell. Default based on number of rows height of shape will defined.na-text:TreatNAvalues text representation.na-color:Cell color forNAvalues.style:optionaldict, to apply css properties.style.padding:Dict like object or int. Default 5px(left, right, top, bottom). Ifstyle: {padding: 10}will set the padding (left, right, top, bottom) as 10px.style: {padding: {left: .., right: .., top: .., bottom: ..}}accept rawintvalue in pixels or afunction: python expression. This expression can usehandler,row,columnandvalueparameters.
Example:
data:
  heatgrid: { url: $YAMLPATH/heatgrid.csv }
draw-heatgrid:
  Heatgrid Rectangle:
    heatgrid:
      data: data['heatgrid']
      row: name
      column: hour
      value: value
      text: True
      left-margin: 0.20
      cell-width: 30
      cell-height: 30
      na-text: NA
      na-color: "#cccccc"
      style:
        # padding: 10        # Setting padding 10px(left, right, top, bottom)
        # ------ OR --------
        # padding:
        #    left:           # Setting left padding from a function
        #      function: module.function(handler, row, column, value)
        # ------ OR --------
        # padding:
        #    left:           # Setting left padding from a function
        #      function: module.function(handler, row, column, value)
        #    right: 10       # Defining right padding 10px

        gradient: RdYlGn
        font-size: 14
        margin: 10
        text-align: center
The following keys can also be specified as an expression and python functions:
data:, row:, column:, value: and subelements of style section.
Sankey
data:A DataFrame.sort:TrueorFalseif true data will get sorted while drawing sankey.text:Function to show text in sankey.order:Groups order.color:Color function based on whichgroups:Group column names from data.
Example:
data:
  sankey: { url: $YAMLPATH/sankey.csv }
draw-sankey:
  Sankey Rectangle:
    sankey:
      data: data['sankey']
      sort: True
      text:
        function: "lambda g: g.sum().apply(lambda v: 'Node %s' % (v.name,), axis=1)"
      order:
        function: "lambda g: -g['D'].sum() / g['E'].sum()"
      color:
        function: "lambda g: _color.gradient(g['D'].sum() / g['E'].sum() * 2 - 1, _color.RdYlGn)"
      groups: ["A", "B", "C"]
The following keys can also be specified as an expression and python functions:
data:, size:, order:, text:, color.
Treemap
data:A DataFrame.keys:Group column names aslist.values:Aggregate function to apply on each group.size:Treemap’s box size function.sort:Function to sort treemap’s rectangles based onsortfunction.color:A DataFrame.text:Function to show text in treemap.
Example:
data:
  treemap: { url: $YAMLPATH/treemap.csv }
draw-treemap:
  Treemap Rectangle:
    treemap:
      data: data['treemap']
      keys: ["Family"]
      values: "{'screentime': 'sum'}"
      size:
        function: "lambda v: v['screentime']"
      sort:
        function: "lambda v: v.sort_values(by=['screentime'], ascending=False)"
      color:
        function: "lambda v: _color.gradient(v['screentime'] / 50 - 3, _color.RdYlGn)"
      text:
        function: "lambda v: '{}'.format(v['Family'])"
The following keys can also be specified as an expression and python functions:
data:, size:, keys:, values:, sort, color, text.
PPTGen Command Line
PPTGen uses a configuration to modify files. The configuration defines the
source, target, data and any number of rules.
On the command line, it accepts a YAML file as input. For example, this
text.yaml copies input.pptx to output.pptx and changes the title to “New Title”:
source: input.pptx # optional path to source. Default to blank PPT with 1 slide
target: output.pptx # required path to save output as
change:
  Title 1: # Take the shape named "Title 1"
    text: New Title # Replace its text with "New Title"
This can be run as:
pptgen text.yaml
You can override parameters from the command line like this:
pptgen config.yaml --target new.pptx "--change.Title 1.text" "Updated title"