How gramener’s cutting edge
visual data journalism cut
republic tv a huge slice of
primetime viewership

Challenge

To make the TV audience make sense of complex election data and help media houses tract more primetime viewership

Approach

Gramener’s insights platform is enabling quick and efficient viewership data analysis

Outcome

80% reduction in data extraction efforts, analytics and communication efforts halved

A word of appreciation from the client

About the customer

Republic (Republic TV and Republic World) is India’s first independent media tech company. Founded by Arnab Goswami and launched in 2017, Republic TV is India’s most watched english news channel from its week of launch.

Gramener partnered Republic TV for the first time for an exclusive coverage of the Gujarat Assembly Elections 2017. The objective of the partnership was to do real time election data analysis on counting days with cutting edge analytics and visualization tools. The objective was to deliver the TV audience important valuable as election stories.

The partnership to deliver crystal clear election insights with real-time dynamic visualization continued during Assembly Elections 2018, and the General Elections 2019.

THE PROBLEM

Election battles are a massive affair of interest for the general public as well as the media houses. News channels covering the elections with comprehensive data and narratives bags huge prime time viewership. In such a scenario, Republic TV needed a competitive edge while delivering election stories.

The Indian General Election is the biggest in the world. It involves over 300 political parties, 8,000 candidates, 800 million voters, and 1 million voting booths served and secured by 20 million officials. There is a variety of structured and unstructured information such as candidate histories, crime records, and declared assets to tap data from. In addition to this is the frenetic activity on the day of results. Live streaming of results happens while over 21,000 votes are counted each second, in all corners of the country, which spans an area of nearly 1 million square miles.

Thus, elections are a classic BIG DATA problem.

On the day the votes were counted, Republic TV had real-time data flowing in. This election reporting needed new analytics and visualization techniques to automate election insights discovery so that journalists can do what they are good at doing, but faster and better.

Gramener's visual swiss army knife

Compass

Compass enabled real-time tracking of the party performance and swing seats. Here audience had a chance to observe the change in seats from one party to the other with respect to time. It highlighted the party that had been leading the previous three assembly polls in the constituency.

Strike Rate

The strike rate was an indicator of the party performance. It compared the number of seats where it was leading with the total number of seats contested in.

Chord

The Chord offered a visual analysis of seats gained and lost by the parties in the current elections compared to the previous elections. It showed a real-time transfer of seats from one party to another.

The Color Map

The color map is the combination of a pie chart and a map view breaking down the parties by color and applying region wise filters. Hovering on the colorful dots representing political parties highlighted the constituency name.

The Voter Matrix

The Voter Matrix presented a timeline of leads and actual vote share in a dot plot format. It helped to track how the constituencies had gained or lost seats as counting progressed.

Winners and Runners

One of the most exciting storyboards, it was a post-result representation of winners and runner-ups, party-wise across seats. It was a perfect end to the nail-biting-close-fight scenarios from the election counting day.

THE IMPACT

Republic TV offered their audience an unforgettable visual experience of discovering real-time insights and stories from election data.
Republic TV’s HD over-the-top content (online streaming) recorded 122 Mn watch minutes during the General Elections counting day.
Due to viewership surge on the General Elections counting day, Republic TV experienced 100% rise in weekly impressions from 0.6 to 1.4 Mn.
Republic TV recorded a 50% market share in over 1 Mn cities and 51% market share in megacities during 2017 Gujarat Assembly Elections reportage.

Read more case studies

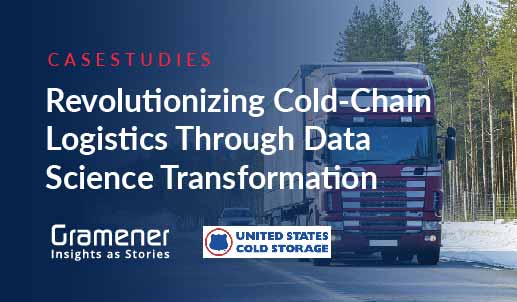
Revolutionizing Cold-Chain Logistics with Data Science

Gramener helped logistics leader United States Cold Storage revolutionize its logistics operations with a unique 'advisory-to-implementation’ approach.

Read More

Predicting Disasters with SEEDS India and Microsoft

Gramener, in partnership with Microsoft, developed a Machine Learning – driven disaster impact model to predict disasters and save lives.

Read More

Transforming America's Food System using AI with USCS

We joined hands with USCS, a major in cold chain industry, to build an Intelligent Appointment Scheduler to automate the manual carrier scheduling.

Read More

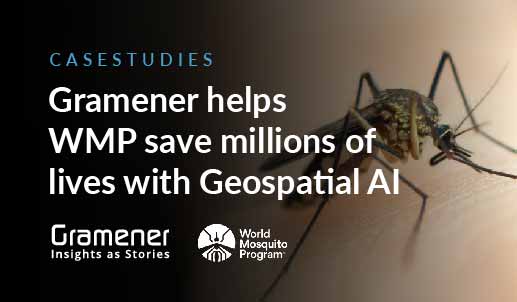
Fighting Diseases with Geospatial AI

Read and download the case study of our partnership with Microsoft and World Mosquito Program (WMP) to build Geospatial AI driven solution to fight mosquito borne diseases.

Read More

Building Urban Resilience with Spatial Analytics

Our partnership with Microsoft and Evergreen Canada resulted in building urban resilience by analyzing climate change & other datasets & building a unique Data Visualization tool.

Read More

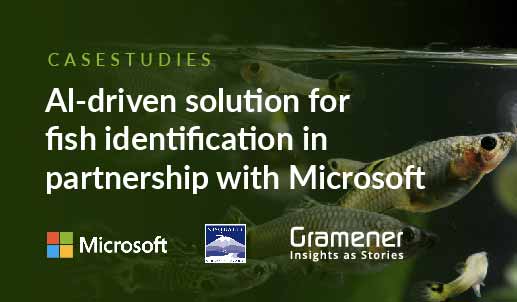
Salmon Detection Web App For Nisqually River Foundation

Read and download the case study of our partnership with Microsoft to develop AI solutions to automate fish species identification at the Nisqually River Foundation.

Read More

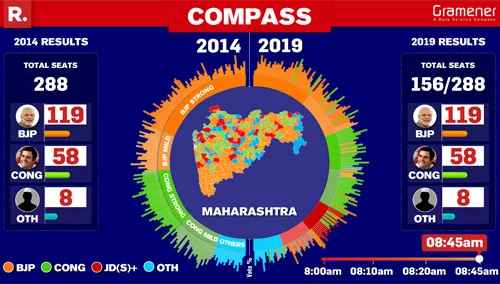
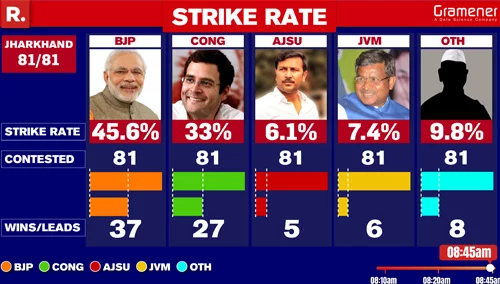
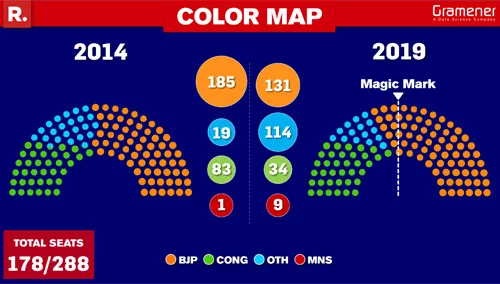
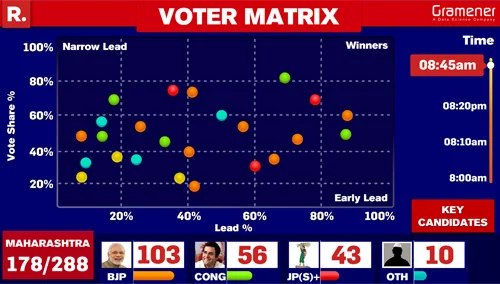
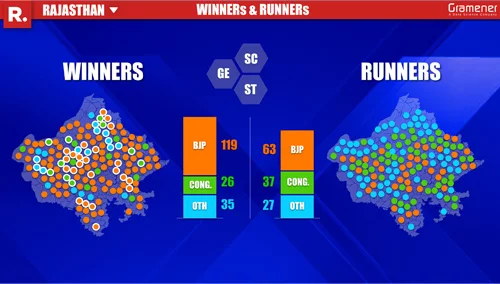
Primetime Viewership using Visual Data Journalism with Republic TV

Read and download the case study to know how Republic TV simplified election data reporting using data journalism and a cutting-edge visual analytics tool from Gramener.

Read More

Automated Insights from Viewership Insights Platform

Read and download the case study to know how Star India is leveraging the Insights platform to understand their viewership across regions and create better content.

Read More

Data-Driven Design Thinking with Micro Focus

Read and download the case study to know how Micro Focus pitched its cybersecurity solution to a competitive market with data-driven design and storytelling features.

Read More

BI Reporting with Unified Data Marketplace For Conduent

Read and download the case study to know how Conduent is using a unified data marketplace to collaborate all BI reports at one place, enabling quick decision-making.

Read More

Visual Analytics Platform For Operational Excellence At DHFL

Read and download the case study to know how DHFL was able to sell their retail portfolio worth 15 thousand crores INR to nine banks using a visual analytics platform.

Read More

Get a Copy of the case study

Learn why 150+ enterprises worldwide trust Gramener as their Data & AI partner
ISO-
for-footer
Fill in the Details